

Question: Selected hypothetical comparative financial data (in thousands, except for share price) for Cineplex Inc. are shown below. Revenue Interest expense Income tax expense Profit for
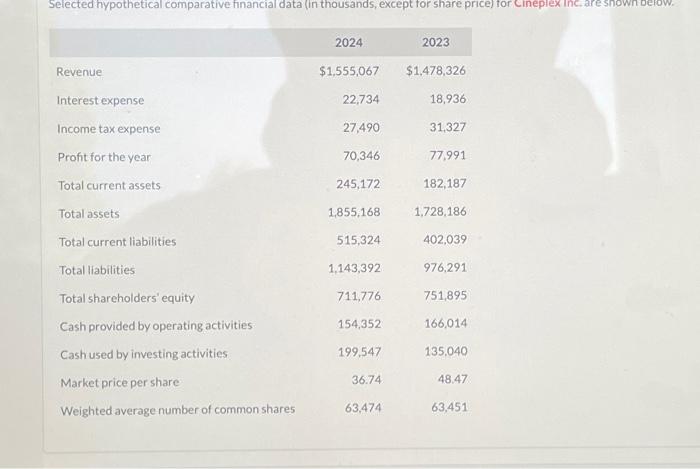
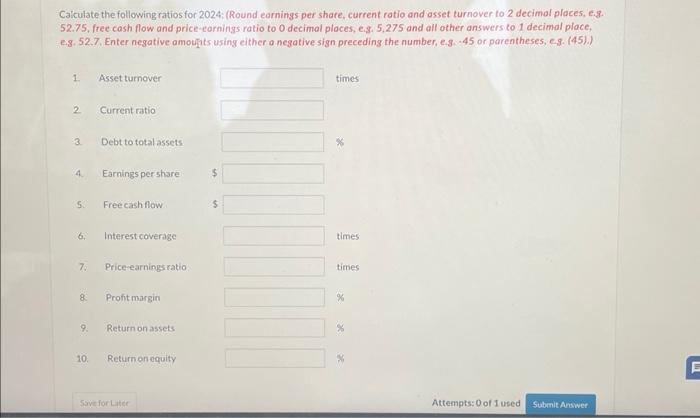
Selected hypothetical comparative financial data (in thousands, except for share price) for cineplex inc. are snown oefow. \begin{tabular}{lrr} & \multicolumn{1}{c}{} & \multicolumn{1}{c}{2024} \\ \hline Revenue & $1,555,067 & $1,478,326 \\ Interest expense & 22,734 & 18,936 \\ \hline Income tax expense & 27,490 & 31,327 \\ Profit for the year & 70,346 & 77,991 \\ Total current assets & 245,172 & 182,187 \\ Total assets & 1,855,168 & 1,728,186 \\ \hline Total current liabilities & 515,324 & 402,039 \\ Total liabilities & 1,143,392 & 976,291 \\ Total shareholders' equity & 711,776 & 751,895 \\ \hline Cash provided by operating activities & 154,352 & 166,014 \\ \hline Cash used by investing activities & 199,547 & 135,040 \\ Market price per share & 36,74 & 48,47 \\ \hline Weighted average number of common shares & 63,474 & 63,451 \end{tabular} Caiculate the following ratios for 2024: (Round earnings per share, current ratio and asset turnover to 2 decimol places, e.g. 52.75, free cash fow and price earnings ratio to 0 decimat ptaces, e, 8,5,275 and all other answers to 1 decimal place. Es. 52.7. Enter negative amoupits using either a negative sign preceding the number, e.3. -45 or parentheses, es. (45).)
Step by Step Solution
There are 3 Steps involved in it

Get step-by-step solutions from verified subject matter experts