

Question: The graph is a scatter plot with 8 points, each representing the low temperature and high temperature of 8 days in September in a certain
The graph is a scatter plot with 8 points, each representing the low temperature and high temperature of 8 days in September in a certain city. Both the low temperatures and high temperatures are measured in degrees Fahrenheit. The line of best fit for the data is also shown.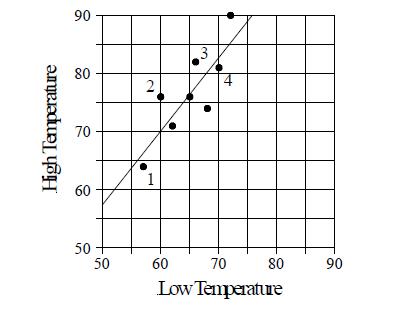 What is the predicted high temperature of the day when the low temperature is 58?
A) 65
B) 68
C) 71
D) 74
High Temperature 90 80 70 60 50 50 2 1 3 H 60 70 Low Temperature 80 90
Step by Step Solution
★★★★★
3.43 Rating (156 Votes )
There are 3 Steps involved in it
1 Expert Approved Answer
Step: 1 Unlock

B When the low temperature is 5... View full answer
Question Has Been Solved by an Expert!
Get step-by-step solutions from verified subject matter experts
Step: 2 Unlock
Step: 3 Unlock