

Question: The graph is a scatter plot with 8 points, each representing the low temperature and high temperature of 8 days in September in a certain
The graph is a scatter plot with 8 points, each representing the low temperature and high temperature of 8 days in September in a certain city. Both the low temperatures and high temperatures are measured in degrees Fahrenheit. The line of best fit for the data is also shown.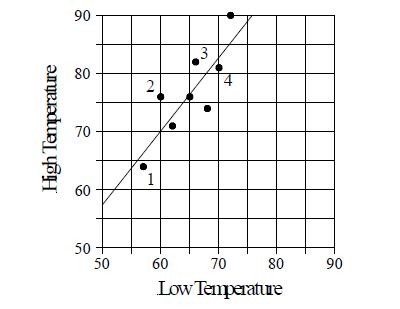 Among the four days marked 1, 2, 3, and 4 in the scatter plot, on which day is the difference between the high temperature and the low temperature minimal?
A) Day 1
B) Day 2
C) Day 3
D) Day 4
High Temperature 90 80 70 60 50 50 2 1 3 H 60 70 Low Temperature 80 90
Step by Step Solution
3.38 Rating (167 Votes )
There are 3 Steps involved in it
A In Day 1 the approximate high temperature is 64 and the ... View full answer

Get step-by-step solutions from verified subject matter experts