

The graph shows the size of a certain insect population over 25 days. The population at time
Question:
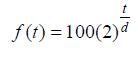
The graph shows the size of a certain insect population over 25 days. The population at time t = 0 was 100. A biologist used the equationto model the population.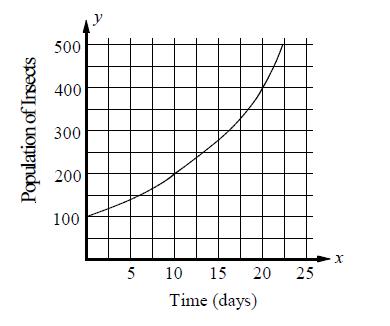
What was the population of the insect after 15 days, to the nearest whole number?
Fantastic news! We've Found the answer you've been seeking!
Step by Step Answer:
ft 1002 d 10 2 a 15 f15 1002 ...View the full answer

Answered By
Muhammad Salman Alvi
Well, I am a student of Electrical Engineeing from Information Technology University of Punjab. Just getting into my final year. I have always been good at doing Mathematics, Physics, hardware and technical subjects. Teaching profession requires a alot of responsibilities and challenges.
My teaching experience started as an home tutor a year ago. When I started teaching mathematics and physic subjects to an O Level student. He was about 14 years old. His name was Ibrahim and I used to teach him for about 2 hours daily. Teaching him required a lot of patience but I had to be polite with him. I used to give him a 5 min break after 1 hour session. He was quite weak in basic maths and calculation. He used to do quite a lot of mistakes in his homework which I gave him weekly. So I decided to teach him basics from scratch. He used to say that he got the concept even if he didn't. So I had to ask him again and again. I worked on his basics for a month and after that I started taking a weekly test sesions. After few months he started to improve gradually. Now after teaching him for about a year I can proudly say that he has improved alot. The most important thing was he managed to communicate all the difficullties he was facing. He was quite capable and patient. I had a sincere desire to help him reach to its full potential. So I managed to do that. We had a very good honest relationship of a student and a teacher. I loved teaching him as a tutor. Now having an experience of one year teaching I can read students quite well. I look forward to work as an online tutor who could help students in solving their all sort of difficulties, problems and queries.
29+ Reviews
43+ Question Solved
Related Book For 

Question Posted:
