Redesign the VOCs adsorber of Example 9.15 for a breakthrough time of (4.0 mathrm{~h}). The pressure drop
Question:
Redesign the VOCs adsorber of Example 9.15 for a breakthrough time of \(4.0 \mathrm{~h}\). The pressure drop through the bed [calculated using the Ergun equation (2-95)] should not exceed \(1.0 \mathrm{kPa}\). Calculate the new dimensions of the bed and the total amount of activated carbon required.
Data From Example 9.15:-
Monoclonal antibodies (MAbs) are antibodies produced by hybridoma cells. These cells are clones resulting from cell fusion of lymphocytes (antibody-secreting cells) and myeloma cells (malignant tumor cells) that have the capability of secreting single species of antibodies and can be cultivated. Antibodies are immunoglobins normally produced by the immune system of living organisms to combat the invasion of foreign substances, or antigens. Over the last few years, commercial interest in MAbs has rapidly increased. They have great potential as therapeutic agents for hematologic malignancies and other diseases. They are also important as affinity ligands for purifying other pharmaceutical substances of importance. Therefore, cost-efficient methods for purifying large quantities of MAbs are important (Montgomery et al., 1998). The biological activity of molecules, such as proteins, cells, and viruses, can easily be destroyed by processing conditions that do not conform to their natural environment. Therefore, traditional separation processes, such as distillation or solvent extraction, are seldom used to isolate them. Affinity adsorption is one of the most effective methods for the direct isolation and purification of biomolecules from complex mixtures (Camperi et al., 2003). It is based on recognition between a pair of molecules determined by the steric structure (three-dimensional arrangement of its atoms) of the molecules. When molecules have complementary steric structures, they can interact to maximize the hydrogen bonds and electrostatic interactions. Affinity adsorption allows a separation process with high specificity and purity. Camperi et al. (2003) employed affinity adsorption to isolate and purify a monoclonal antibody against GM-CSF (granulocyte macrophage–colony stimulating factor) using a peptide affinity ligand attached to agarose (a polysaccharide extracted from agar) in a fixed bed. The adsorbed MAb was recovered quantitatively by elution of the bed with 5 M LiCl. They performed preliminary adsorption equilibrium experiments and found a Langmuir-type isotherm of the form
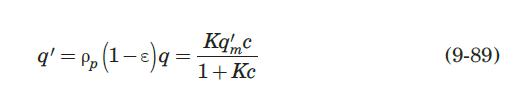
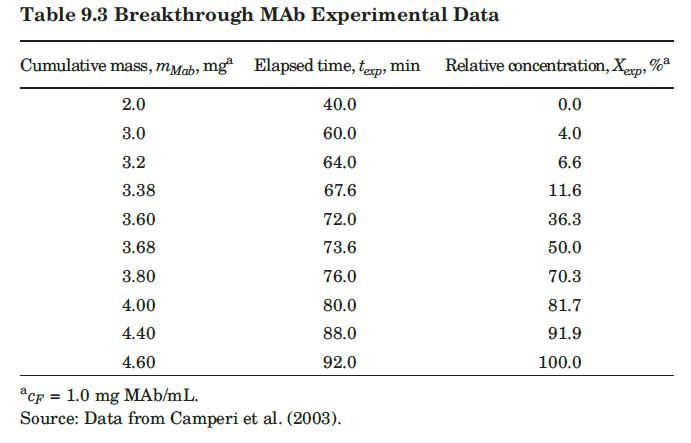
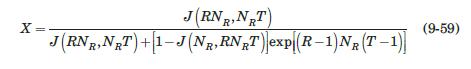
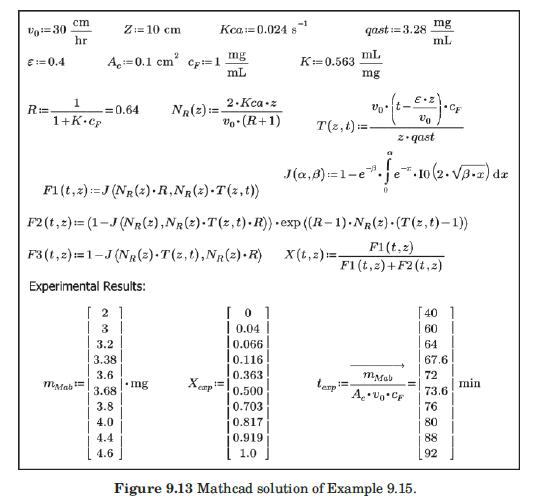
with q in mg/mL of bed and c in mg/mL of solution. They reported a value of qm′ = 9.1mg / mL.. These researchers generated experimental breakthrough curves using a 1.0- mL column packed with the affinity adsorption matrix. The solution containing different feed concentrations of the MAb (0.1, 0.2, and 1.0 mg/mL) was pumped through the bed at a superficial velocity v0 = 0.5 cm/min. The breakthrough results were expressed in terms of the relative MAb concentration in the effluent (Xexp) versus cumulative mass of the MAb (mMAb, mg) applied to the column. Besides the total volume, no further details were given about the column. For computational purposes, we will assume a column length Z = 10 cm, cross-sectional area Ac = 0.1 cm2, and porosity ε = 40%. The breakthrough experimental results for cF = 1.0 mg MAb/mL solution are given in Table 9.3. The cumulative mass of MAb applied to the column can be converted to elapsed time from the relation texp = mMAb/v0AccF. According to the adsorption model with Langmuir isotherm presented in Section equation (9.4.3, the value of the dimensionless time parameter T [see equation (9-63)] must be close to 1.0 for X = 50%. From Table 9.3, texp = 73.6 min for Xexp = 50%. Substituting in equation (9-63) and letting T = 1.0, ρp(1 – ε)q* = 3.28 mg MAb/mL bed. Assuming that the value of qm′ = 9.1mg / mL is accurate, from equation (9-89), K = 0.563 mL/mg. The dynamics of the fixed-bed affinity adsorption process were simulated using equations (9-59) to (9-63). The value of the overall volumetric mass-transfer coefficient Kca was selected by trial and error until a good fit to the experimental
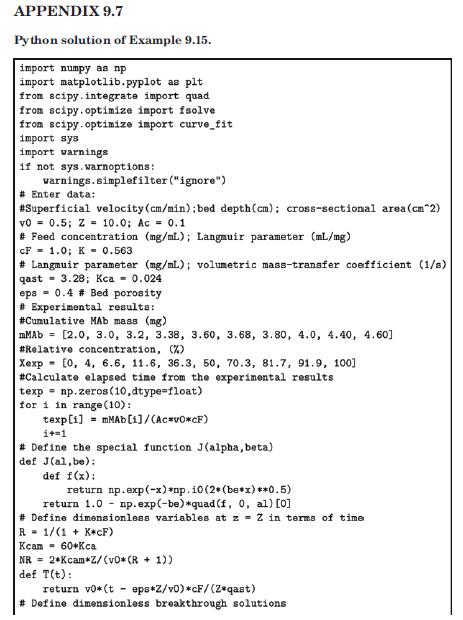
data was achieved. Figure 9.13 shows that excellent agreement between the experimental results of Camperi et al. (2003) and the model predictions was achieved for Kca = 0.024 s–1 using Mathcad. Appendix 9.7 shows the calculations using Python.
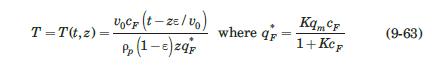
Data From Equation 9-59 and 9-63:-
Data From Figure 9.13:-
Data From Appendix 9.7:-
Step by Step Answer: