

The table shows the frequency distribution of the number of children in each of 8 families. Add
Question:
The table shows the frequency distribution of the number of children in each of 8 families.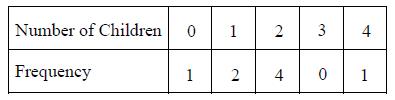
Add 2 to each entry on the original list. Let ma and da be the new mean and the new standard deviation of the data set. Which of the following is true?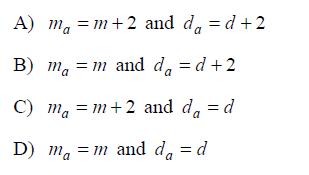
Fantastic news! We've Found the answer you've been seeking!
Step by Step Answer:
C Add 2 to each entry on the original list The n...View the full answer

Answered By
PALASH JHANWAR
I am a Chartered Accountant with AIR 45 in CA - IPCC. I am a Merit Holder ( B.Com ). The following is my educational details.
PLEASE ACCESS MY RESUME FROM THE FOLLOWING LINK: https://drive.google.com/file/d/1hYR1uch-ff6MRC_cDB07K6VqY9kQ3SFL/view?usp=sharing
3+ Reviews
10+ Question Solved
Related Book For 
Question Posted:
