

The table shows the frequency distribution of two lists. List A and list B each contain 40
Question:
The table shows the frequency distribution of two lists. List A and list B each contain 40 numbers.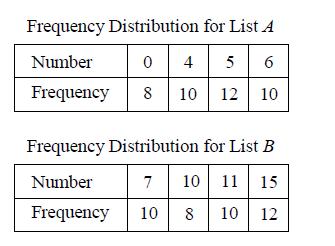
What is the difference between the average of the numbers in list Band the average of the numbers in list A?
A) 6.5
B) 7
C) 7.5
D) 8
Fantastic news! We've Found the answer you've been seeking!
Step by Step Answer:
B Frequency Distribution for ...View the full answer

Answered By
FREDRICK MUSYOKI
Professional Qualities:
Solution-oriented.
Self-motivated.
Excellent problem-solving and critical thinking skills.
Good organization, time management and prioritization.
Efficient troubleshooting abilities.
Tutoring Qualities:
I appreciate students as individuals.
I am used to tailoring resources for individual needs.
I can integrate IT into student's lessons.
I am good at explaining concepts.
I am able to help students progress.
I have a wide curriculum knowledge.
1+ Reviews
10+ Question Solved
Related Book For 
Question Posted:
