

Question: (a) Text, take a rectangular wave of area 1 from 1 to 1 + k. Graph the responses for a sequence of values of k
(b) Experiment on the response of the ODE (or of another ODE of your choice) to an impulse δ(t - α) for various systematically chosen α (> 0); choose initial conditions y(0) ‰ 0, y' (0) = 0. Also consider the solution if no impulse is applied. Is there a dependence of the response on α? On b if you choose bδ(t - α)? Would -δ(t - αˆ¼) with αˆ¼ > α annihilate the effect of δ(t - α)? Can you think of other questions that one could consider experimentally by inspecting graphs?
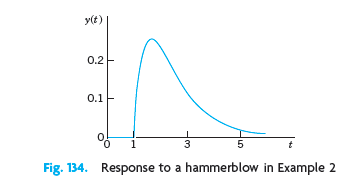
y(t) 0.2 0.1- 3 5 Response to a hammerblow in Example 2 Fig. 134.
Step by Step Solution
★★★★★
3.39 Rating (177 Votes )
There are 3 Steps involved in it
1 Expert Approved Answer
Step: 1 Unlock

You should become aware that careful observation of graphs may lead ... View full answer
Question Has Been Solved by an Expert!
Get step-by-step solutions from verified subject matter experts
Step: 2 Unlock
Step: 3 Unlock