

Question: Extend Example 3 as follows.(a) Verify the values in Table 21.13 and show them graphically as in Fig. 452. Data from Table 21.13 Fig 452
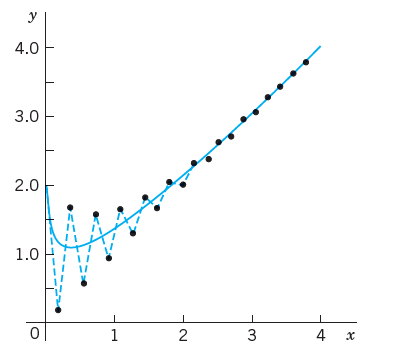
Extend Example 3 as follows.(a) Verify the values in Table 21.13 and show them graphically as in Fig. 452.
Data from Table 21.13
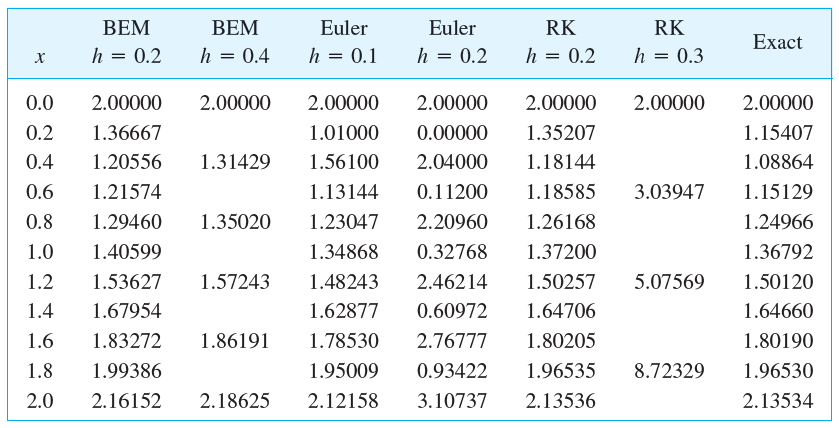
Fig 452
 (b) Compute and graph Euler values for h near the ?critical? h = 0.18 to determine more exactly when instability starts.
(c) Compute and graph RK values for values of h between 0.2 and 0.3 to find h for which the RK approximation begins to increase away from the exact solution.
(d) Compute and graph backward Euler values for large h; confirm stability and investigate the error increase for growing h.
X BEM h = 0.2 0.0 2.00000 0.2 1.36667 0.4 1.20556 0.6 1.21574 0.8 1.29460 1.0 1.40599 1.2 1.53627 1.4 1.67954 1.6 1.83272 1.8 1.99386 2.0 2.16152 BEM h = 0.4 2.00000 1.31429 1.35020 1.57243 1.86191 Euler h = 0.1 Euler h = 0.2 RK h = 0.2 2.00000 2.00000 1.01000 0.00000 1.56100 2.04000 1.13144 0.11200 1.23047 2.20960 1.34868 0.32768 1.48243 2.46214 1.62877 0.60972 1.78530 2.76777 1.80205 1.95009 0.93422 1.96535 2.13536 2.18625 2.12158 3.10737 RK h = 0.3 2.00000 1.35207 1.18144 1.18585 3.03947 1.26168 1.37200 1.50257 5.07569 1.64706 2.00000 8.72329 Exact 2.00000 1.15407 1.08864 1.15129 1.24966 1.36792 1.50120 1.64660 1.80190 1.96530 2.13534
Step by Step Solution
3.33 Rating (150 Votes )
There are 3 Steps involved in it
U21 U23 ... View full answer

Get step-by-step solutions from verified subject matter experts