

The following option prices were observed for calls and puts on a stock on July 6 of
Question:
The following option prices were observed for calls and puts on a stock on July 6 of a particular year. Use this information for problems. The stock was priced at 165.13. The expirations are July 17, August 21, and October 16. The continuously compounded risk-free rates associated with the three expirations are 0.0503, 0.0535, and 0.0571, respectively. The standard deviation is 0.21.
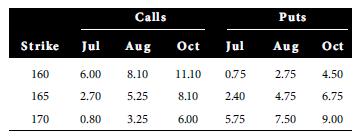
For problems, determine the profits for the holding period indicated for possible stock prices of 150, 155, 160, 165, 170, 175, and 180 at the end of the holding period. Answer any other questions as indicated. Your Excel spreadsheet Stratlyz8e.xls will be useful here for obtaining graphs as requested but it does not allow you to calculate the profits for several user-specified asset prices. It permits you to specify one asset price and a maximum and minimum. Use Stratlyz8e.xls to produce the graph for the range of prices from 150 to 180 but determine the profits for the prices of 150, 155, …, 180 by hand for positions held to expiration. For positions closed prior to expiration, use the spreadsheet BSMbin8e.xls to determine the option price when the position is closed; then calculate the profit by hand.
Construct a collar using the October 160 put. First use the Black-Scholes-Merton model to identify a call that will make the collar have zero up-front cost. Then close the position on September 20. Use the spreadsheet to find the profits for the possible stock prices on September 20. Generate a graph and use it to identify the approximate breakeven stock price. Determine the maximum and minimum profits.
Step by Step Answer:
ANSWER To construct a collar we will buy a put option and sell a call option with the same expiratio...View the full answer


Introduction To Derivatives And Risk Management
ISBN: 9780324601213
8th Edition
Authors: Robert Brooks, Don M Chance, Roberts Brooks
