

Question: (a) Using the data provided in Table 2.2 , complete Table 2.3 by calculating the relative concentration (conc rel ) values for (i) mantle (peridotite)
(a) Using the data provided in Table 2.2 , complete Table 2.3 by calculating the relative concentration (concrel) values for (i) mantle (peridotite) rocks, (ii) oceanic crust rocks, and (iii) continental crust rocks, compared with carbonaceous chondrite composition. Indicate whether each of the calculated values represents relative enrichment or relative depletion for the different elements in the terrestrial rocks. Express your results to no more than three significant figures.
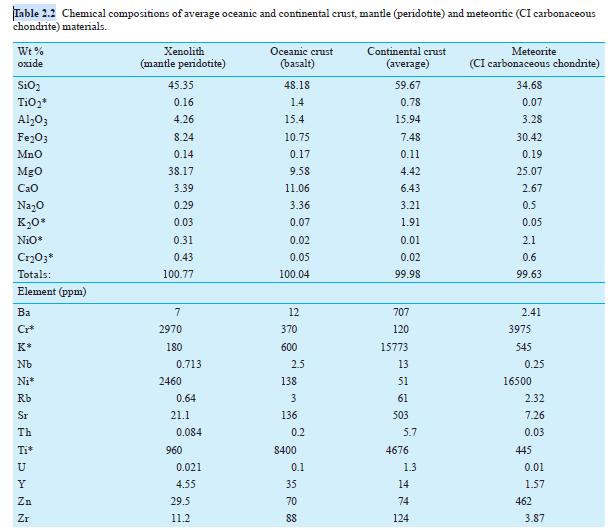
Table 2.2
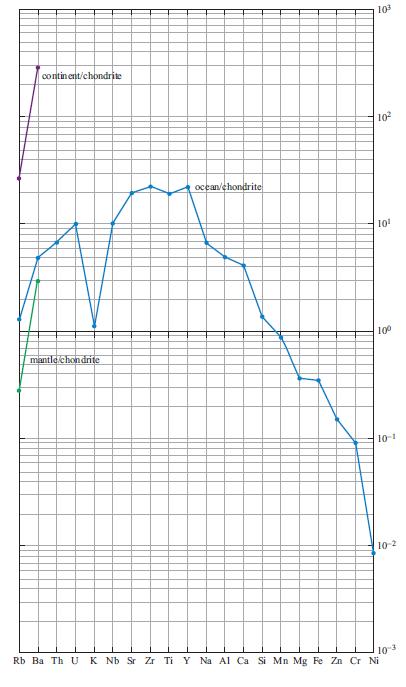
(b) Plot your results from Table 2.3 on the graph in Figure 2.3. Consider Cr, Ni, K and Ti as ppm values only. Data for chondrite normalized ocean crust, together with the first two points for chondrite normalized peridotite (mantle) and continental crust, have already been plotted. The order of elements has been chosen to illustrate the main differences and similarities in these three chondrites normalized. (i.e. spidergram) patterns.
Table 2.3
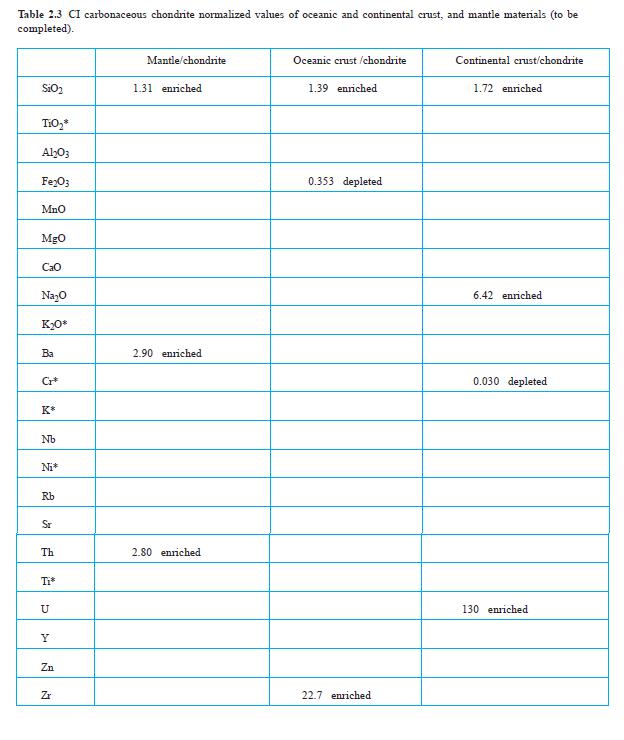
Figure 2.3
(c) What can you deduce must have happened to the element distribution within the Earth since its condensation and accretion from the solar nebula?
Table 2.2 Chemical compositions of average oceanic and continental crust, mantle (peridotite) and meteoritic (CI carbonaceous chondrite) materials. Wt% oxide SiO TiO* AlO3 Fe2O3 Mno MgO CaO NaO K0* Nio* CrO3* Totals: Element (ppm) Ba Cr* K* Nb Ni* Rb Sr Th Ti* U Y Zn Zr Xenolith (mantle peridotite) 45.35 0.16 4.26 8.24 0.14 38.17 3.39 0.29 0.03 0.31 0.43 100.77 7 2970 180 0.713 2460 0.64 21.1 0.084 960 0.021 4.55 29.5 11.2 Oceanic crust (basalt) 48.18 1.4 15.4 10.75 0.17 9.58 11.06 3.36 0.07 0.02 0.05 100.04 12 370 600 2.5 138 3 136 0.2 $400 0.1 35 70 88 Continental crust (average) 59.67 0.78 15.94 7.48 0.11 4.42 6.43 3.21 1.91 0.01 0.02 99.98 707 120 15773 13 51 61 503 5.7 4676 1.3 14 74 124 Meteorite (CI carbonaceous chondrite) 34.68 0.07 3.28 30.42 0.19 25.07 2.67 0.5 0.05 2.1 0.6 99.63 2.41 3975 545 0.25 16500 2.32 7.26 0.03 445 0.01 1.57 462 3.87
Step by Step Solution
3.37 Rating (153 Votes )
There are 3 Steps involved in it
a b c Assuming that primitive meteorites planetesimals and planetary embryos all condensed from similar nebula materials prior to assembling to form the Earth then both meteoritic and Earth materials ... View full answer

Get step-by-step solutions from verified subject matter experts