

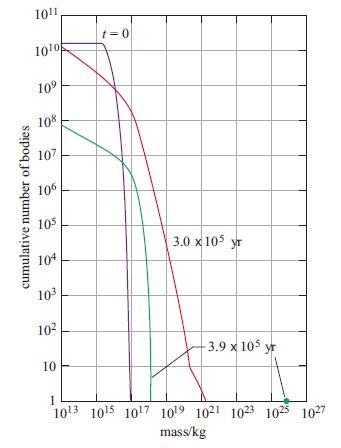
The simulations in Figures 8.16 and 8.17 both begin with a population of planetesimals between about 10
Question:
The simulations in Figures 8.16 and 8.17 both begin with a population of planetesimals between about 1016 and 1017 kg in mass, i.e. about 10 km diameter. The flat tops to the curves for t = 0 show that there are no planetesimals less than about 1016 kg in mass. In both simulations, at times later than t = 0 the low-mass ends of the curves slope down to the right. What does this tell you about the masses of the smallest bodies present at these later times, and to what process do you attribute this?
Figure 8.16
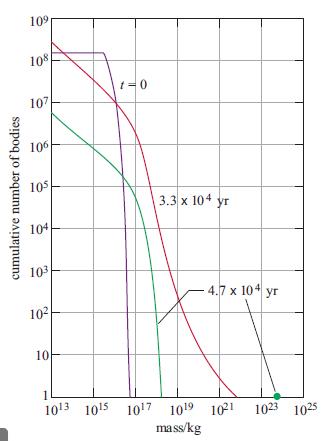
Figure 8.17
Fantastic news! We've Found the answer you've been seeking!
Step by Step Answer:
These are cumulative curves As we follow a curve from right to left it climbs which shows that the t...View the full answer

Answered By
Antony Odumo
I have immense passion for Mathematics and have been a mathematics faculty for almost 6 years.
Subject Expertise: I have a wide range of knowledge across multiple subjects, including but not limited to math, science, I can provide in-depth explanations, examples, and demonstrations to help students understand complex concepts.
Customized Instruction: I can tailor my tutoring approach to match the individual learning style and pace of each student. Whether a student is a visual learner, auditory learner, or kinesthetic learner, I can adapt my instruction accordingly to optimize their understanding and retention of the material.
Clear Communication: I am skilled in explaining concepts in a clear and concise manner, using simple language that students can easily understand. I can break down complex ideas into smaller, manageable parts, and provide step-by-step guidance to help students grasp the content.
Problem-Solving Skills: I am adept at helping students develop critical thinking and problem-solving skills. I can guide them through the process of analyzing problems, identifying relevant information, and applying appropriate strategies to arrive at solutions.
Patience and Empathy: I understand that every student learns at their own pace and may have different strengths and weaknesses. I am patient and empathetic, creating a supportive and non-judgmental learning environment. I encourage questions and provide constructive feedback to help students improve their understanding and performance.
Flexibility and Adaptability: I can adapt my tutoring style based on the changing needs of students. I can modify my approach if a student is struggling with a particular concept or if they need to review previous material. I can also adjust my pace and level of difficulty to challenge advanced students or provide additional support for struggling students.
Technology Integration: I am proficient in utilizing technology and online resources to enhance the tutoring experience. I can provide links to relevant educational materials, share screens for demonstrations, and use interactive tools for engaging and interactive lessons.
Overall, my "hands-on experience / proficiency" as a tutor lies in my ability to provide personalized and effective instruction, adapt to individual learning needs, and utilize my vast knowledge and communication skills to help students succeed in their academic pursuits
0 Reviews
10+ Question Solved
Related Book For 
An Introduction To The Solar System
ISBN: 9781108430845
3rd Edition
Authors: David A. Rothery, Neil McBride, Iain Gilmour
Question Posted:
