

Table 3.1 in Chapter 3 presents financial statements over the period 2014 through 2017 for R&E Supplies,
Question:
Table 3.1 in Chapter 3 presents financial statements over the period 2014 through 2017 for R&E Supplies, Inc.
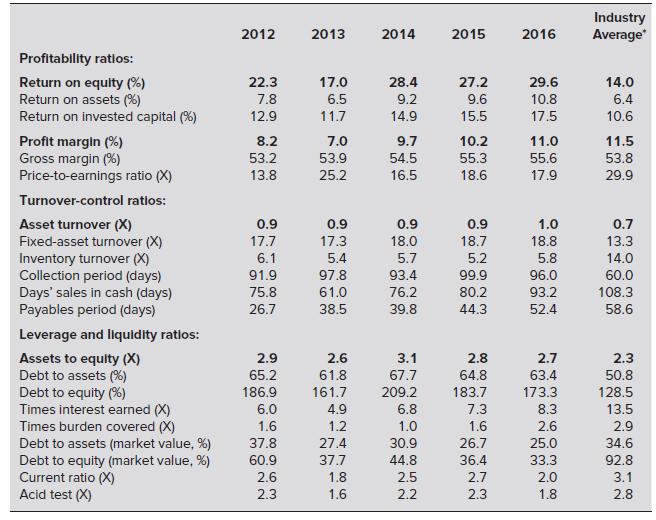
a. Use these statements to calculate as many of the ratios in Table 2.2 as you can.
b. What insights do these ratios provide about R&E’s financial performance? What problems, if any, does the company appear to have?
Table 3.1
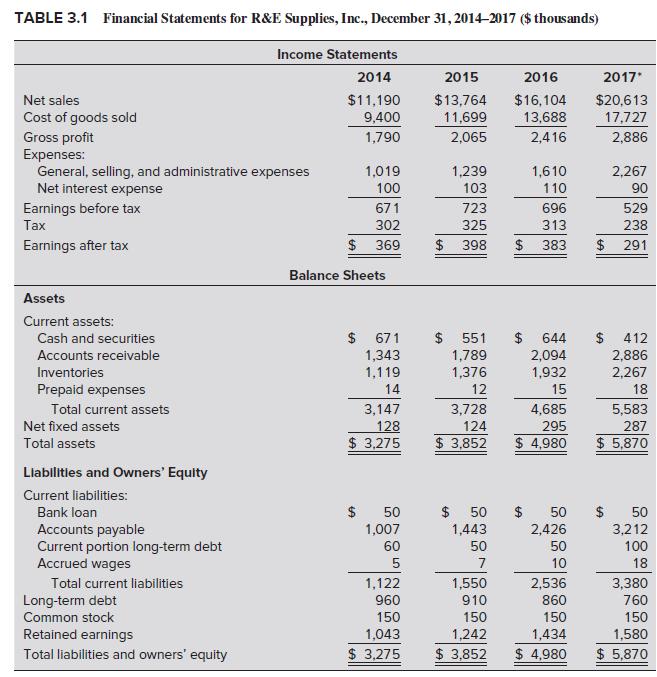
Table 2.2
Financial statements are the standardized formats to present the financial information related to a business or an organization for its users. Financial statements contain the historical information as well as current period’s financial...
Fantastic news! We've Found the answer you've been seeking!
Step by Step Answer:
a RE Supplies Incratio analysis 2014 2015 2016 2017 Profitability ratios Return on equity 309 286 24...View the full answer

Answered By
Stacy kosgei
I offer quality, original and timely services; Highly credible and void of plagiarism. Your success is my pleasure.
2+ Reviews
10+ Question Solved
Related Book For 
Question Posted:
