

Figure 1.11 shows the amount of nicotine, N = f(t), in mg, in a persons bloodstream as
Question:
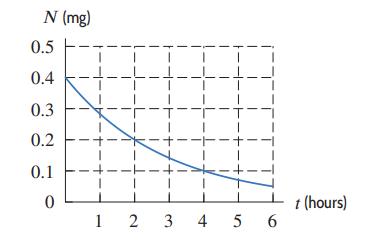
Figure 1.11 shows the amount of nicotine, N = f(t), in mg, in a person’s bloodstream as a function of the time, t, in hours, since the person finished smoking a cigarette.
(a) Estimate f(3) and interpret it in terms of nicotine.
(b) About how many hours have passed before the nicotine level is down to 0.1 mg?
(c) What is the vertical intercept? What does it represent in terms of nicotine?
(d) If this function had a horizontal intercept, what would it represent?
Figure 1.11
Fantastic news! We've Found the answer you've been seeking!
Step by Step Answer:
a From the graph we estimate f3 014 This means that after 3 hours the lev...View the full answer

Answered By
Susan Juma
I'm available and reachable 24/7. I have high experience in helping students with their assignments, proposals, and dissertations. Most importantly, I'm a professional accountant and I can handle all kinds of accounting and finance problems.
15+ Reviews
45+ Question Solved
Related Book For 

Applied Calculus
ISBN: 9781119275565
6th Edition
Authors: Deborah Hughes Hallett, Patti Frazer Lock, Andrew M. Gleason, Daniel E. Flath, Sheldon P. Gordon, David O. Lomen, David Lovelock, William G. McCallum, Brad G. Osgood, Andrew Pasquale
Question Posted:
