

Figure 1.44 shows the amount of nicotine N = f(t), in mg, in a persons bloodstream as
Question:
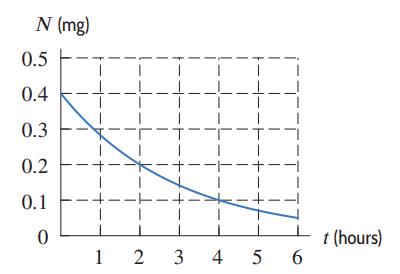
Figure 1.44 shows the amount of nicotine N = f(t), in mg, in a person’s bloodstream as a function of the time, t, in hours, since the last cigarette.
(a) Is the average rate of change in nicotine level positive or negative? Explain.
(b) Find the average rate of change in the nicotine level between t = 0 and t = 3. Give units and interpret your answer in terms of nicotine.
Fantastic news! We've Found the answer you've been seeking!
Step by Step Answer:
a As time passes after a cigarette is smoked the nicotine level in the body decreases s...View the full answer

Answered By
Susan Juma
I'm available and reachable 24/7. I have high experience in helping students with their assignments, proposals, and dissertations. Most importantly, I'm a professional accountant and I can handle all kinds of accounting and finance problems.
15+ Reviews
45+ Question Solved
Related Book For 

Applied Calculus
ISBN: 9781119275565
6th Edition
Authors: Deborah Hughes Hallett, Patti Frazer Lock, Andrew M. Gleason, Daniel E. Flath, Sheldon P. Gordon, David O. Lomen, David Lovelock, William G. McCallum, Brad G. Osgood, Andrew Pasquale
Question Posted:
