

Figure 1.43 shows the length, L, in cm, of a sturgeon (a type of fish) as a
Question:
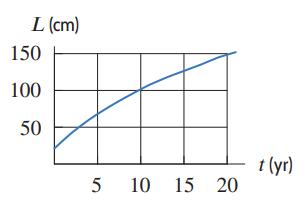
Figure 1.43 shows the length, L, in cm, of a sturgeon (a type of fish) as a function of the time, t, in years.
(a) Is the function increasing or decreasing? Is the graph concave up or concave down?
(b) Estimate the average rate of growth of the sturgeon between t = 5 and t = 15. Give units and interpret your answer in terms of the sturgeon.
Fantastic news! We've Found the answer you've been seeking!
Step by Step Answer:
a This function is increasing and the graph is concave down b F...View the full answer

Answered By
David Ngaruiya
i am a smart worker who concentrates on the content according to my clients' specifications and requirements.
7+ Reviews
19+ Question Solved
Related Book For 

Applied Calculus
ISBN: 9781119275565
6th Edition
Authors: Deborah Hughes Hallett, Patti Frazer Lock, Andrew M. Gleason, Daniel E. Flath, Sheldon P. Gordon, David O. Lomen, David Lovelock, William G. McCallum, Brad G. Osgood, Andrew Pasquale
Question Posted:
