

Figure 5.19 shows the rate of change of a fish population. Estimate the total change in the
Question:
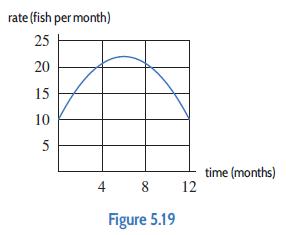
Figure 5.19 shows the rate of change of a fish population. Estimate the total change in the population during this 12-month period.
Fantastic news! We've Found the answer you've been seeking!
Step by Step Answer:
The rate at which the fish population grows varies between 10 fish per month and about 2...View the full answer

Answered By
Muhammad Umair
I have done job as Embedded System Engineer for just four months but after it i have decided to open my own lab and to work on projects that i can launch my own product in market. I work on different softwares like Proteus, Mikroc to program Embedded Systems. My basic work is on Embedded Systems. I have skills in Autocad, Proteus, C++, C programming and i love to share these skills to other to enhance my knowledge too.
1+ Reviews
10+ Question Solved
Related Book For 

Applied Calculus
ISBN: 9781119275565
6th Edition
Authors: Deborah Hughes Hallett, Patti Frazer Lock, Andrew M. Gleason, Daniel E. Flath, Sheldon P. Gordon, David O. Lomen, David Lovelock, William G. McCallum, Brad G. Osgood, Andrew Pasquale
Question Posted:
