

Figure 5.77 shows P'(t), the rate of change of the price of stock in a certain company
Question:
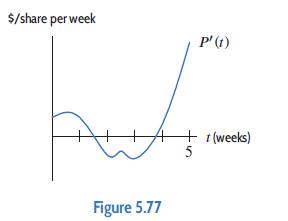
Figure 5.77 shows P'(t), the rate of change of the price of stock in a certain company at time t.
(a) At what time during this five-week period was the stock at its highest value? At its lowest value?
(b) If P(t) represents the price of the stock, arrange the following quantities in increasing order:
P(0), P(1), P(2), P(3), P(4), P(5).
Fantastic news! We've Found the answer you've been seeking!
Step by Step Answer:
a The area under the curve of Pt from 0 to t gives the change in the value of th...View the full answer

Answered By
Shivang Mishra
I am an independent tutor and content developer for Chemistry anf Mathematics upto Senior secondary or high school standard. I am very much familiar with the use of MS-WORD, MS-EXCEL as many of my previous projects were entirely based on it. I have developed numerous mathematical contents on MS-Word and can type any mathematical co tent on it. I am also comfortable with using math type.
I am also an engineering student studying at a premier institute like NIT Jaipur. I have a strong grip over school level mathematics.
The salient features of the content and matter developed by me and teaching that makes me stand out among the others are proper and short explanations, re-checked content, stepwise solutions, and an easy to understand way of arrangement of the complete material.
I have found my interest in this field and so I am planning to expand it a little, which justifies me looking for more such opportunities on this platform.
0 Reviews
10+ Question Solved
Related Book For 

Applied Calculus
ISBN: 9781119275565
6th Edition
Authors: Deborah Hughes Hallett, Patti Frazer Lock, Andrew M. Gleason, Daniel E. Flath, Sheldon P. Gordon, David O. Lomen, David Lovelock, William G. McCallum, Brad G. Osgood, Andrew Pasquale
Question Posted:
