

Figure 5.87 shows the rate, f(x), in thousands of algae per hour, at which a population of
Question:
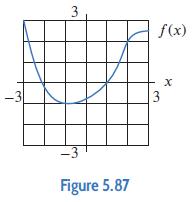
Figure 5.87 shows the rate, f(x), in thousands of algae per hour, at which a population of algae is growing, where x is in hours.
(a) Estimate the average value of the rate over the interval x = −1 to x = 3.
(b) Estimate the total change in the population over the interval x = −3 to x = 3.
Fantastic news! We've Found the answer you've been seeking!
Step by Step Answer:
a Over the interval 1 3 we estimate that the total change of the popula...View the full answer

Answered By
ANDREW KIPRUTO
Academic Writing Expert
I have over 7 years of research and application experience. I am trained and licensed to provide expertise in IT information, computer sciences related topics and other units like chemistry, Business, law, biology, biochemistry, and genetics. I'm a network and IT admin with +8 years of experience in all kind of environments.
I can help you in the following areas:
Networking
- Ethernet, Wireless Airmax and 802.11, fiber networks on GPON/GEPON and WDM
- Protocols and IP Services: VLANs, LACP, ACLs, VPNs, OSPF, BGP, RADIUS, PPPoE, DNS, Proxies, SNMP
- Vendors: MikroTik, Ubiquiti, Cisco, Juniper, HP, Dell, DrayTek, SMC, Zyxel, Furukawa Electric, and many more
- Monitoring Systems: PRTG, Zabbix, Whatsup Gold, TheDude, RRDtoo
Always available for new projects! Contact me for any inquiries
1+ Reviews
10+ Question Solved
Related Book For 

Applied Calculus
ISBN: 9781119275565
6th Edition
Authors: Deborah Hughes Hallett, Patti Frazer Lock, Andrew M. Gleason, Daniel E. Flath, Sheldon P. Gordon, David O. Lomen, David Lovelock, William G. McCallum, Brad G. Osgood, Andrew Pasquale
Question Posted:
