

Figure 8.37 shows cardiac output (in liters per minute) in patients suffering from shock as a function
Question:
Figure 8.37 shows cardiac output (in liters per minute) in patients suffering from shock as a function of blood pressure in the central veins (in mm Hg) and the time in hours since the onset of shock.
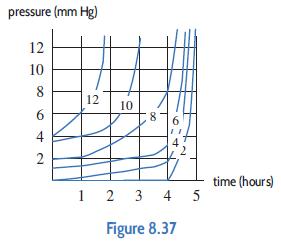
(a) In a patient with blood pressure of 4 mm Hg, what is cardiac output when the patient first goes into shock? Estimate cardiac output three hours later. How much time has passed when cardiac output is reduced to 50% of the initial value?
(b) In patients suffering from shock, is cardiac output an increasing or decreasing function of blood pressure?
(c) Is cardiac output an increasing or decreasing function of time, t, where t represents the elapsed time since the patient went into shock?
(d) If blood pressure is 3 mm Hg, explain how cardiac output changes as a function of time. In particular, does it change rapidly or slowly during the first two hours of shock? During hours 2 to 4? During the last hour of the study? Explain why this information is useful to a physician treating a patient for shock.
Step by Step Answer:
a To find cardiac output o when pressure p 4 mm Hg and time t 0 hours ie when the patient goes into ...View the full answer


Applied Calculus
ISBN: 9781119275565
6th Edition
Authors: Deborah Hughes Hallett, Patti Frazer Lock, Andrew M. Gleason, Daniel E. Flath, Sheldon P. Gordon, David O. Lomen, David Lovelock, William G. McCallum, Brad G. Osgood, Andrew Pasquale
