

Question: Graph the average cost function corresponding to the total cost function shown in Figure 4.67. cost 500 C 1000 Figure 4.67 q (quantity)
Graph the average cost function corresponding to the total cost function shown in Figure 4.67.
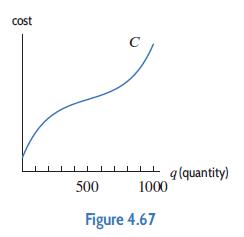
cost 500 C 1000 Figure 4.67 q (quantity)
Step by Step Solution
★★★★★
3.40 Rating (166 Votes )
There are 3 Steps involved in it
1 Expert Approved Answer
Step: 1 Unlock

The graph of the av... View full answer
Question Has Been Solved by an Expert!
Get step-by-step solutions from verified subject matter experts
Step: 2 Unlock
Step: 3 Unlock