

The data in the table describe rug and carpeting shipments ($ billions) and the number of housing
Question:
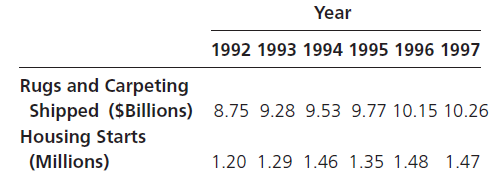
a. Determine the least-squares regression line for predicting rugs and carpeting shipments on the basis of housing starts.
b. Determine and interpret the coefficients of correlation and determination.
c. If there were 1.4 million housing starts in a year, what would be the prediction for rugs and carpeting shipments during that year?
Fantastic news! We've Found the answer you've been seeking!
Step by Step Answer:
a The least squares equation To facilitate pocket calculator computations the following preliminary ...View the full answer

Answered By
Krishnavendra Y
I am a self motivated financial professional knowledgeable in; preparation of financial reports, reconciling and managing accounts, maintaining cash flows, budgets, among other financial reports. I possess strong analytical skills with high attention to detail and accuracy. I am able to act quickly and effectively when dealing with challenging situations. I have the ability to form positive relationships with colleagues and I believe that team work is great key to performance. I always deliver quality, detailed, original (0% plagiarism), well-researched and critically analyzed papers.
4+ Reviews
10+ Question Solved
Related Book For 
Question Posted:
