

Height velocity graphs are used by endocrinologists to follow the progress of children with growth deficiencies. Figure
Question:
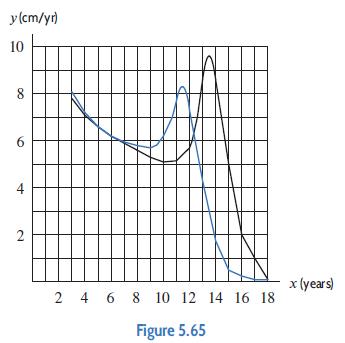
Height velocity graphs are used by endocrinologists to follow the progress of children with growth deficiencies. Figure 5.65 shows the height velocity curves of an average boy and an average girl between ages 3 and 18.
(a) Which curve is for girls and which is for boys? Explain how you can tell.
(b) About how much does the average boy grow between ages 3 and 10?
(c) The growth spurt associated with adolescence and the onset of puberty occurs between ages 12 and 15 for the average boy and between ages 10 and 12.5 for the average girl. Estimate the height gained by each average child during this growth spurt.
(d) When fully grown, about how much taller is the average man than the average woman? (The average boy and girl are about the same height at age 3.)
Step by Step Answer:
a The black curve is for boys the colored one for girls The area under each curve represents the cha...View the full answer


Applied Calculus
ISBN: 9781119275565
6th Edition
Authors: Deborah Hughes Hallett, Patti Frazer Lock, Andrew M. Gleason, Daniel E. Flath, Sheldon P. Gordon, David O. Lomen, David Lovelock, William G. McCallum, Brad G. Osgood, Andrew Pasquale
