

In an agricultural experiment, the quantity of grain from a given size field is measured. The yield
Question:
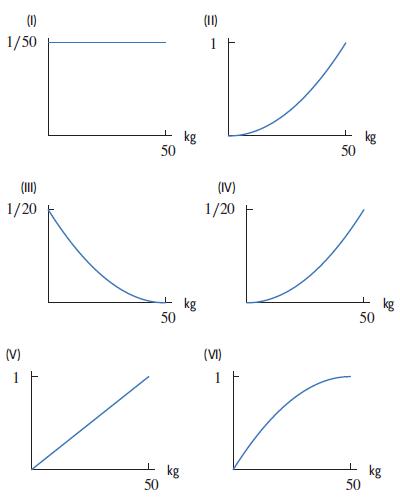
In an agricultural experiment, the quantity of grain from a given size field is measured. The yield can be anything from 0 kg to 50 kg. For each of the following situations, pick the graph that best represents the:
(i) Probability density function
(ii) Cumulative distribution function.
(a) Low yields are more likely than high yields.
(b) All yields are equally likely.
(c) High yields are more likely than low yields.
Fantastic news! We've Found the answer you've been seeking!
Step by Step Answer:
a i The probability density function is III ii The cu...View the full answer

Answered By
Joseph Mwaura
I have been teaching college students in various subjects for 9 years now. Besides, I have been tutoring online with several tutoring companies from 2010 to date. The 9 years of experience as a tutor has enabled me to develop multiple tutoring skills and see thousands of students excel in their education and in life after school which gives me much pleasure. I have assisted students in essay writing and in doing academic research and this has helped me be well versed with the various writing styles such as APA, MLA, Chicago/ Turabian, Harvard. I am always ready to handle work at any hour and in any way as students specify. In my tutoring journey, excellence has always been my guiding standard.
1+ Reviews
10+ Question Solved
Related Book For 

Applied Calculus
ISBN: 9781119275565
6th Edition
Authors: Deborah Hughes Hallett, Patti Frazer Lock, Andrew M. Gleason, Daniel E. Flath, Sheldon P. Gordon, David O. Lomen, David Lovelock, William G. McCallum, Brad G. Osgood, Andrew Pasquale
Question Posted:
