

In Figure 1.120, the blue curve shows monthly mean carbon dioxide (CO 2 ) concentration, in parts
Question:
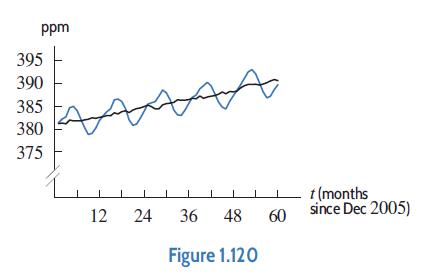
In Figure 1.120, the blue curve shows monthly mean carbon dioxide (CO2) concentration, in parts per million (ppm) at Mauna Loa Observatory, Hawaii, as a function of t, in months, since December 2005. The black curve shows the monthly mean concentration adjusted for seasonal CO2 variation.
(a) Approximately how much did the monthly mean CO2 increase between December 2005 and December 2010?
(b) Find the average monthly rate of increase of the monthly mean CO2 between December 2005 and December 2010. Use this information to find a linear function that approximates the black curve.
(c) The seasonal CO2 variation between December 2005 and December 2010 can be approximated by a sinusoidal function of the form A sin Bt. What is the approximate period of the function? What is its amplitude? Give a formula for the function.
(d) The blue curve may be approximated by a function of the form ℎ(t) = f(t) + g(t), where f(t) is sinusoidal and g(t) is linear. Using your work in parts (b) and (c), find a possible formula for ℎ(t). Graph ℎ(t) using the scale in Figure 1.120.
Step by Step Answer:
a The monthly mean CO 2 increased about 10 ppm between December 2005 and December 2010 This is becau...View the full answer


Applied Calculus
ISBN: 9781119275565
6th Edition
Authors: Deborah Hughes Hallett, Patti Frazer Lock, Andrew M. Gleason, Daniel E. Flath, Sheldon P. Gordon, David O. Lomen, David Lovelock, William G. McCallum, Brad G. Osgood, Andrew Pasquale
