

Question: Is the function, whose graph is drawn in Fig. 7, continuous at the following values of x? x = 2 + -5 -4 -3 -2
Is the function, whose graph is drawn in Fig. 7, continuous at the following values of x?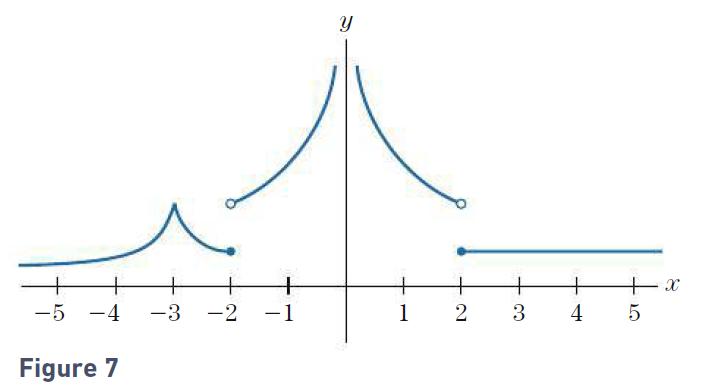 x = 2
x = 2
+ -5 -4 -3 -2 -1 Figure 7 y 1 2 3 + 4 5 X
Step by Step Solution
★★★★★
3.53 Rating (156 Votes )
There are 3 Steps involved in it
1 Expert Approved Answer
Step: 1 Unlock

Question Has Been Solved by an Expert!
Get step-by-step solutions from verified subject matter experts
Step: 2 Unlock
Step: 3 Unlock