

Question: Refer to Table 8.3, which shows the weekly beef consumption, C, (in lbs) of an average household as a function of p, the price of
Refer to Table 8.3, which shows the weekly beef consumption, C, (in lbs) of an average household as a function of p, the price of beef (in $/lb) and I, annual household income (in $1000s).
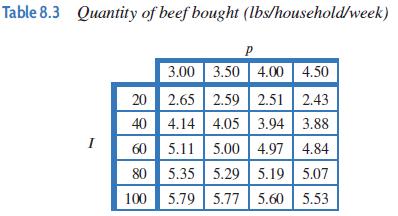
Make a table of the proportion, P, of household income spent on beef per week as a function of price and income.
Table 8.3 Quantity of beef bought (lbs/household/week) I P 3.00 3.50 4.00 4.50 20 2.65 2.59 2.51 2.43 40 4.14 4.05 3.94 3.88 60 5.11 5.00 4.97 4.84 5.35 5.29 5.19 5.07 100 5.79 5.77 5.60 5.53 888 80
Step by Step Solution
3.30 Rating (150 Votes )
There are 3 Steps involved in it
Table 88 gives the amount M spent on beef per household per week Thus the ... View full answer

Get step-by-step solutions from verified subject matter experts