

Question: Question 9 of 10 < > - / 1 The table below shows the weekly beef consumption, C, (in lbs) of an average household
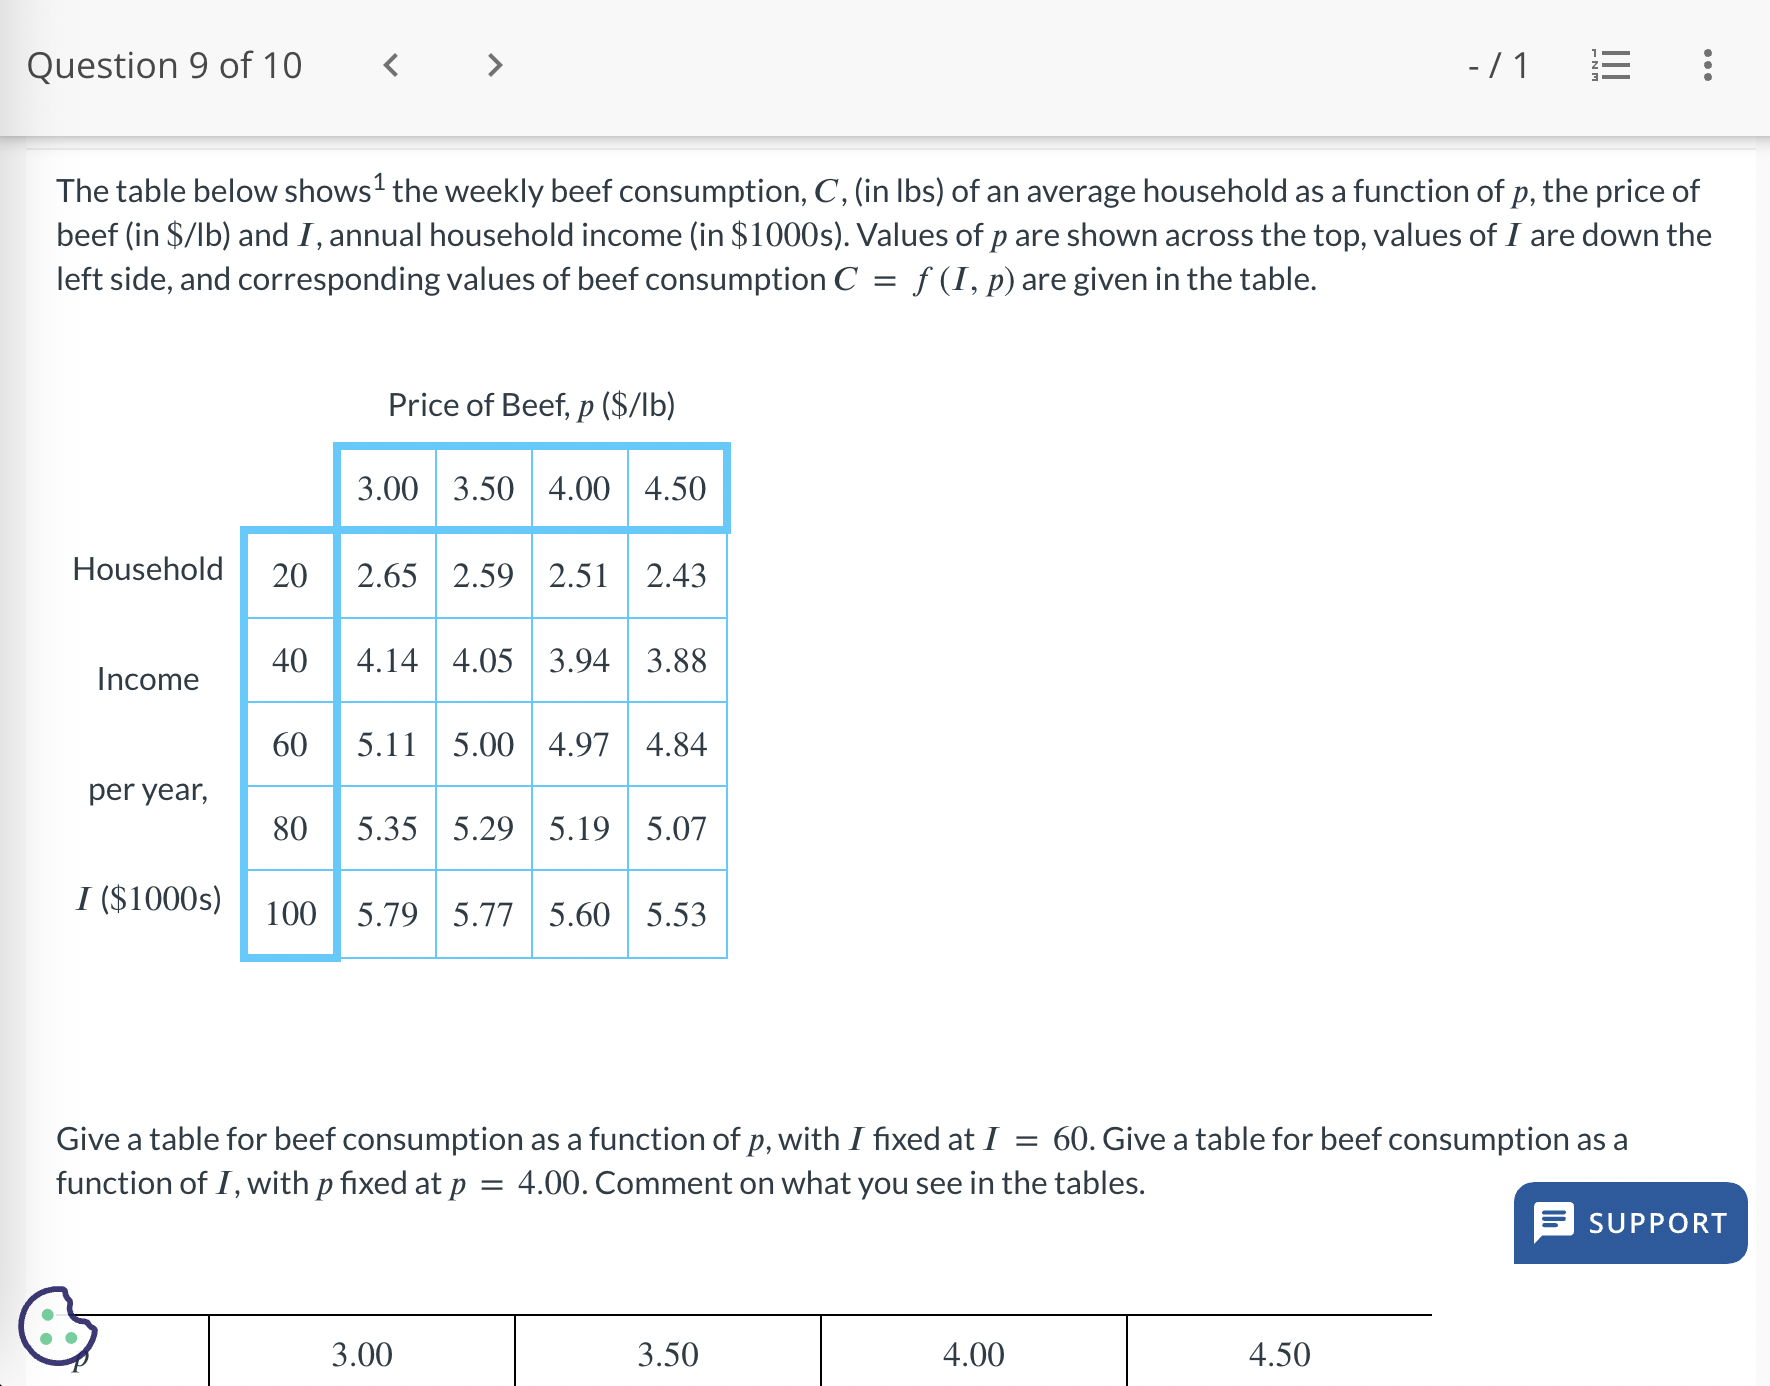
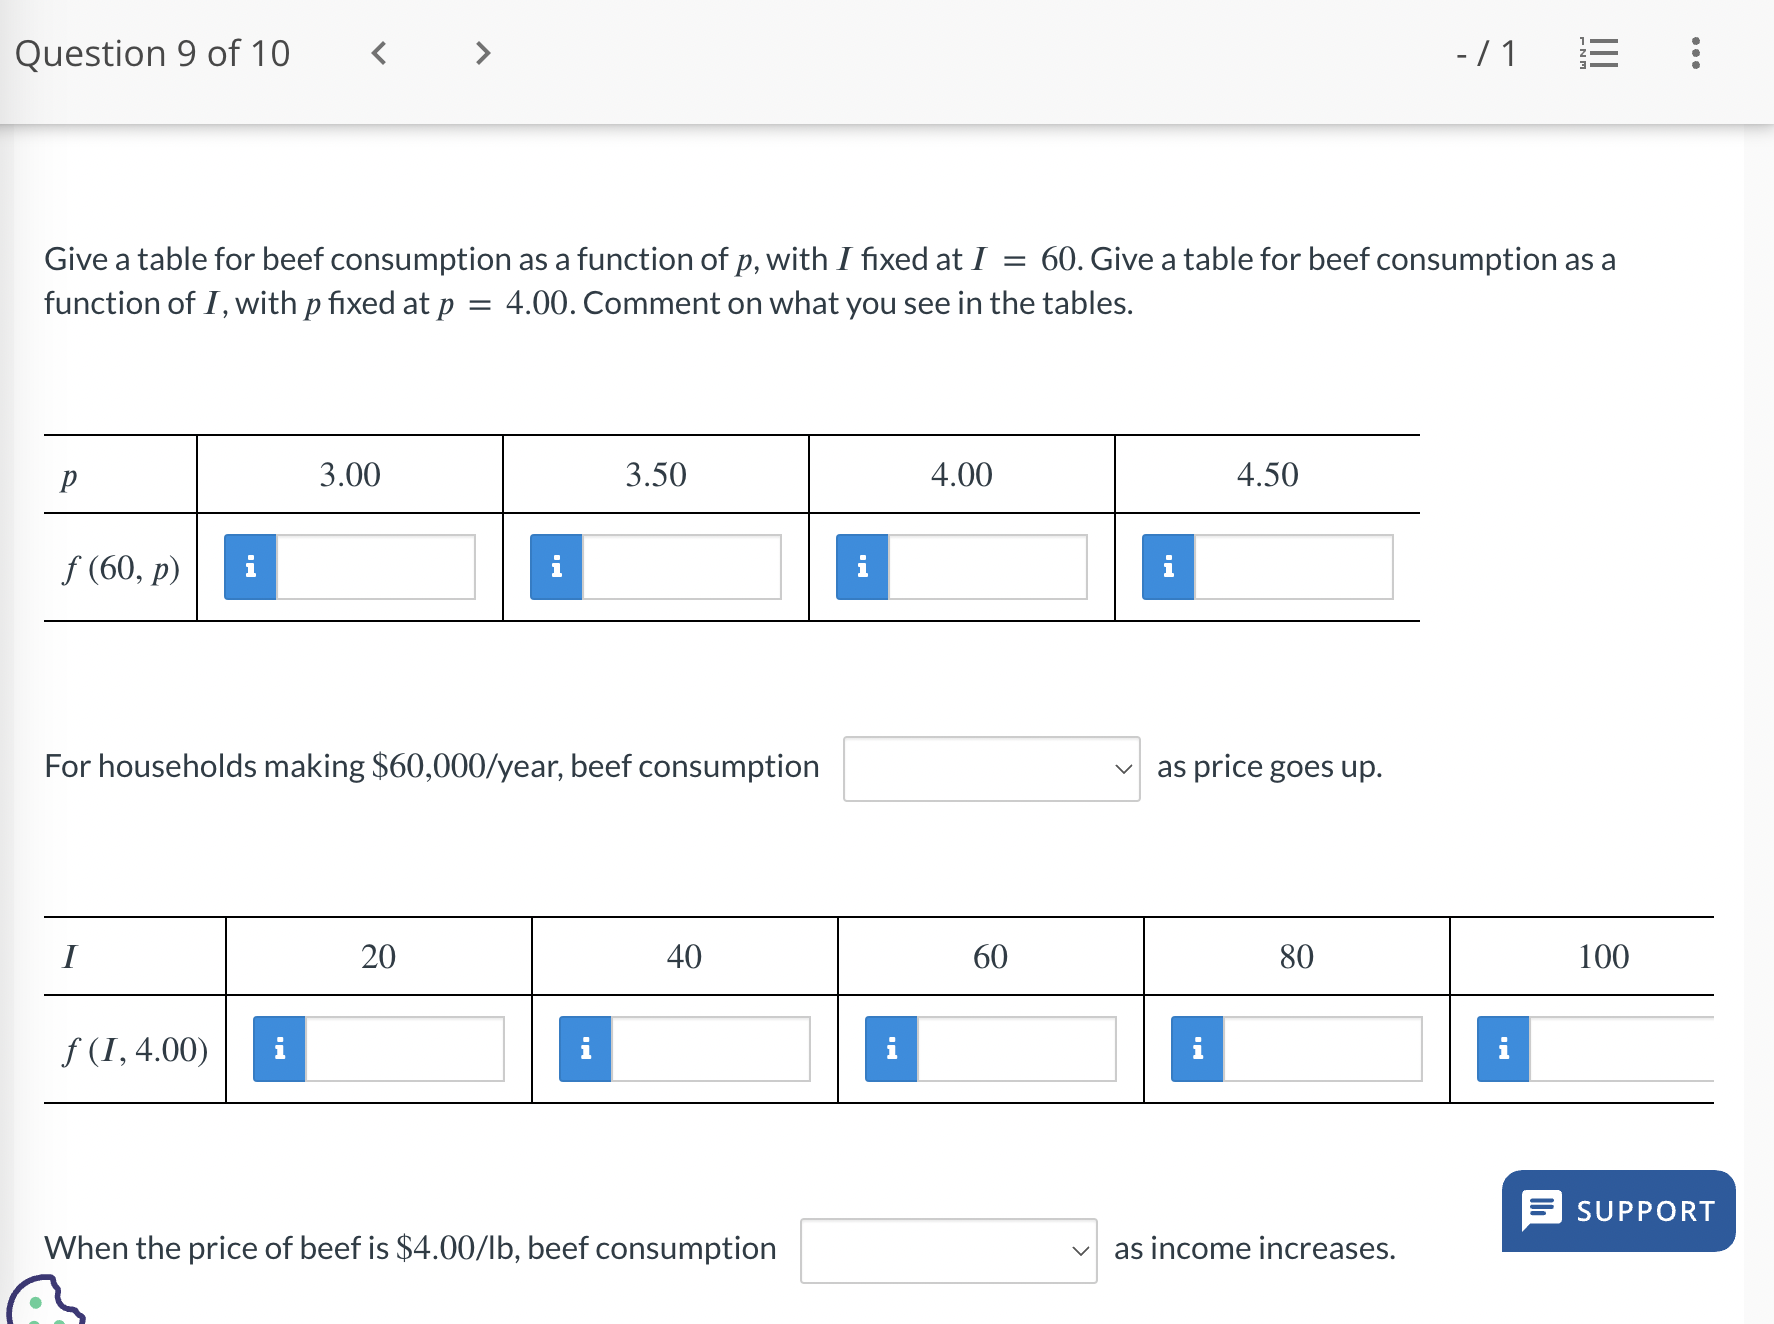
Question 9 of 10 < > - / 1 The table below shows the weekly beef consumption, C, (in lbs) of an average household as a function of p, the price of beef (in $/lb) and I, annual household income (in $1000s). Values of p are shown across the top, values of I are down the left side, and corresponding values of beef consumption C f (I, p) are given in the table. = Price of Beef, p ($/lb) 3.00 3.50 4.00 4.50 Household 20 40 Income 20 40 2.65 2.59 2.51 2.43 4.14 4.05 3.94 3.88 60 60 5.11 5.00 4.97 4.84 per year, 88 80 5.35 5.29 5.19 5.07 I ($1000s) 100 5.79 5.77 5.60 5.53 Give a table for beef consumption as a function of p, with I fixed at I function of I, with p fixed at p = 4.00. Comment on what you see in the tables. = 60. Give a table for beef consumption as a SUPPORT 3.00 3.50 4.00 4.50 Question 9 of 10 < > -/1 Give a table for beef consumption as a function of p, with I fixed at I = 60. Give a table for beef consumption as a function of I, with p fixed at p = 4.00. Comment on what you see in the tables. P f (60, p) 3.00 3.50 4.00 4.50 For households making $60,000/year, beef consumption I f (I, 4.00) as price goes up. 20 40 60 80 100 = SUPPORT When the price of beef is $4.00/lb, beef consumption as income increases.
Step by Step Solution
There are 3 Steps involved in it

Get step-by-step solutions from verified subject matter experts