

Question: Refer to the map in Figure 8.8 shown below. Give the range of daily high temperatures for: (a) Pennsylvania (b) North Dakota (c) California 60s
Refer to the map in Figure 8.8 shown below.
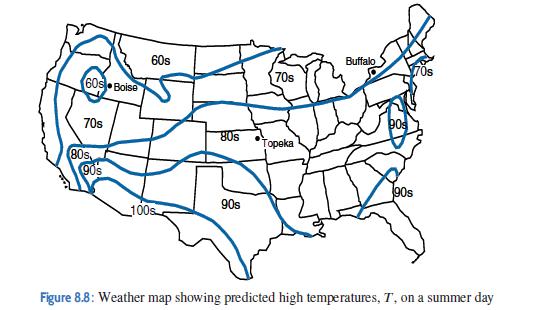
Give the range of daily high temperatures for:
(a) Pennsylvania
(b) North Dakota
(c) California
60s Boise 70s 80s 90s 60s 100s 80s 90s 70s Topeka Buffalo 90s 90s Figure 8.8: Weather map showing predicted high temperatures, T, on a summer day
Step by Step Solution
★★★★★
3.37 Rating (156 Votes )
There are 3 Steps involved in it
1 Expert Approved Answer
Step: 1 Unlock

a 80... View full answer
Question Has Been Solved by an Expert!
Get step-by-step solutions from verified subject matter experts
Step: 2 Unlock
Step: 3 Unlock