

Refer to the map in Figure 8.8 on page 346. Sketch possible graphs of the predicted high
Question:
Refer to the map in Figure 8.8 on page 346.
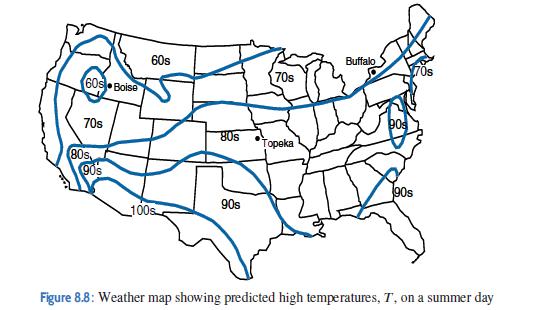
Sketch possible graphs of the predicted high temperature on a north-south line and an east-west line through Boise.
Fantastic news! We've Found the answer you've been seeking!
Step by Step Answer:
North 100 80 B...View the full answer

Answered By
Abigael martinez
I have been a tutor for over 3 years and have had the opportunity to work with students of all ages and backgrounds. I have a strong belief that all students have the ability to learn and succeed if given the right tools and support. I am patient and adaptable, and I take the time to get to know each student's individual learning style in order to best support their needs. I am confident in my ability to help students improve their grades and reach their academic goals.
1+ Reviews
10+ Question Solved
Related Book For 

Applied Calculus
ISBN: 9781119275565
6th Edition
Authors: Deborah Hughes Hallett, Patti Frazer Lock, Andrew M. Gleason, Daniel E. Flath, Sheldon P. Gordon, David O. Lomen, David Lovelock, William G. McCallum, Brad G. Osgood, Andrew Pasquale
Question Posted:
