

Question: Table 1.12 gives values of a function = f(t). Does this function appear to be increasing or decreasing? Does its graph appear to be
Table 1.12 gives values of a function ω = f(t). Does this function appear to be increasing or decreasing? Does its graph appear to be concave up or concave down?
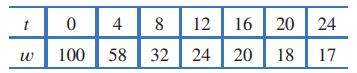
4 8 0 100 58 16 20 20 18 12 16 32 24 20 24 17
Step by Step Solution
★★★★★
3.53 Rating (167 Votes )
There are 3 Steps involved in it
1 Expert Approved Answer
Step: 1 Unlock

As t increases decreases so the function is ... View full answer
Question Has Been Solved by an Expert!
Get step-by-step solutions from verified subject matter experts
Step: 2 Unlock
Step: 3 Unlock