

Question: Table 6 gives the U.S. minimum wage in dollars for certain years. (a) Use the method of least squares to obtain the straight line that
Table 6 gives the U.S. minimum wage in dollars for certain years.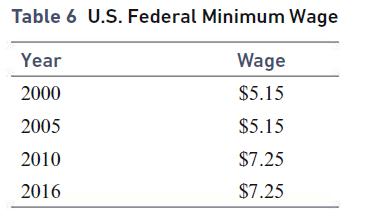
(a) Use the method of least squares to obtain the straight line that best fits these data.
(b) Estimate the minimum wage for the year 2008.
(c) If the trend determined by the straight line in part (a) continues, when will the minimum wage reach $10?
Table 6 U.S. Federal Minimum Wage Year 2000 2005 2010 2016 Wage $5.15 $5.15 $7.25 $7.25
Step by Step Solution
3.38 Rating (170 Votes )
There are 3 Steps involved in it
Given the table convert year to years after 2000 Then we have the data points 0 515 5 51... View full answer

Get step-by-step solutions from verified subject matter experts