

Question: The graph in Fig. 8 shows the total sales in thousands of dollars in a department store during a typical 24-hour period. (a) Estimate the
The graph in Fig. 8 shows the total sales in thousands of dollars in a department store during a typical 24-hour period.
(a) Estimate the rate of sales during the period between 8 a.m. and 10 a.m.
(b) Which 2-hour interval in the day sees the highest rate of sales and what is this rate?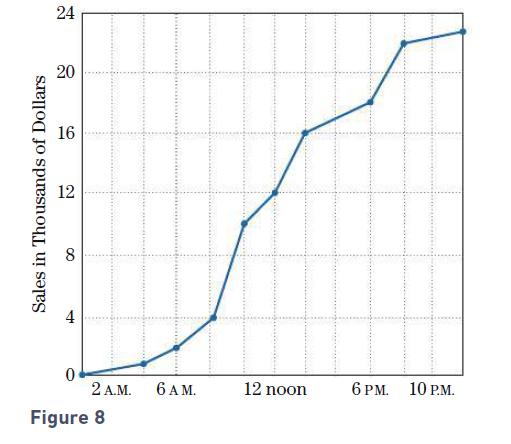
Sales in Thousands of Dollars 24 20 16 12 8 4 0 2 A.M. Figure 8 6 AM. 12 noon 6 PM. 10 P.M.
Step by Step Solution
★★★★★
3.51 Rating (174 Votes )
There are 3 Steps involved in it
1 Expert Approved Answer
Step: 1 Unlock

a The rate of sales is the slope of the line connecting the points 8 4 and 10 ... View full answer
Question Has Been Solved by an Expert!
Get step-by-step solutions from verified subject matter experts
Step: 2 Unlock
Step: 3 Unlock