

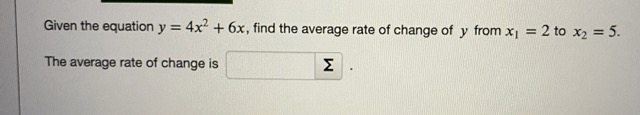
Question: Given the equation y = 4x* + 6x, find the average rate of change of y from x1 = 2 to x2 = 5. The
![Bicycles 16 25 43 70 106 151 (a] Find the change in](https://dsd5zvtm8ll6.cloudfront.net/si.experts.images/questions/2024/10/670913b46548b_116670913b4333f8.jpg)
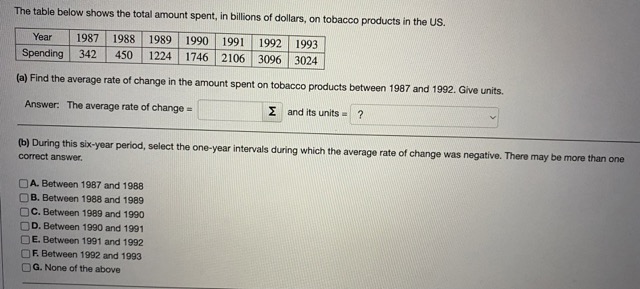
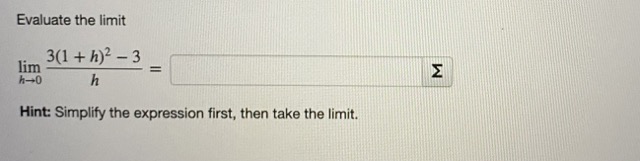
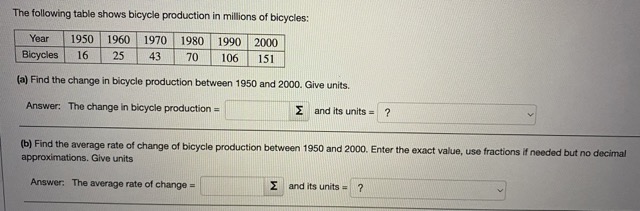
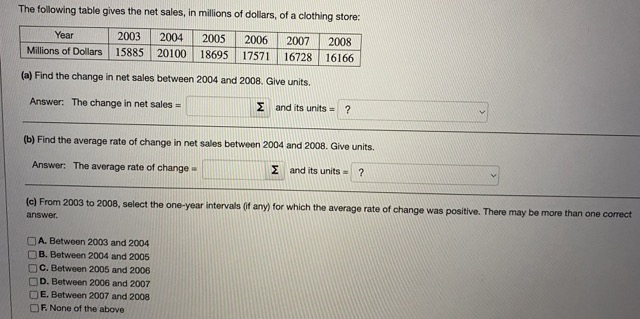
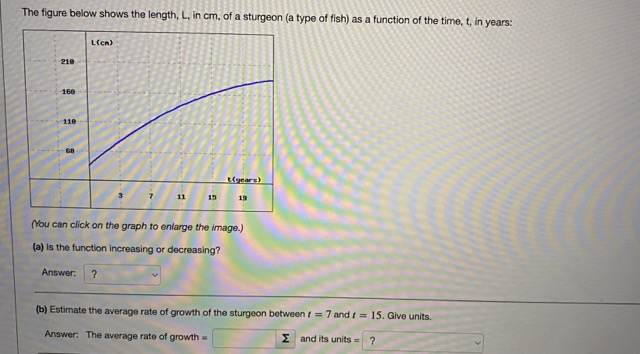
Given the equation y = 4x* + 6x, find the average rate of change of y from x1 = 2 to x2 = 5. The average rate of change is EThe following table shows bicycle production in millions of bicycles: Year 1950 1960 1970 1980 1990 2000 Bicycles 16 25 43 70 106 151 (a] Find the change in bicycle production between 1950 and 2000. Give units. Answer: The change in bicycle production = and its units = ? (b) Find the average rate of change of bicycle production between 1950 and 2000. Enter the exact value, use fractions If needed but no decimal approximations. Give units Answer. The average rate of change = and its units =The following table gives the net sales, in millions of dollars, of a clothing store: Year 2003 2004 2005 2006 2007 2008 Millions of Dollars 15885 20100 18695 17571 16728 16166 (a) Find the change in net sales between 2004 and 2008, Give units, Answer: The change in net sales = and its units = (b) Find the average rate of change in net sales between 2004 and 2008. Give units. Answer: The average rate of change E and its units = ? (c) From 2003 to 2008, select the one-year intervals (if any) for which the average rate of change was positive. There may be more than one correct answer. ()A. Between 2003 and 2004 B. Between 2004 and 2005 C. Between 2005 and 2006 D. Between 2006 and 2007 E. Between 2007 and 2008 OF. None of the aboveThe figure below shows the length, L. in cm, of a sturgeon (a type of fish) as a function of the time, t, in years: 110 t(orare) 11 15 15 (You can click on the graph to enlarge the image.) (a) Is the function increasing or decreasing? Answer: 7 (b) Estimate the average rate of growth of the sturgeon between / = 7 and / = 15. Give units. Answer. The average rate of growth = and its units = ?Each of the functions in the table below is increasing, but each increases in a different way. g(1) h(!) k(1) 5 20 7.1 13 10 21 7.6 23 15 23 8.1 32 20 26 8.6 40 25 30 9.1 47 30 35 9.6 53 Which of the graphs in the figure below best fits each function? (a) (b) (c) Answer: g(1): ? k(D):The table below shows the total amount spent, in billions of dollars, on tobacco products in the US. Year 1987 1988 1989 1990 1991 1992 1993 Spending 342 450 1224 1746 2106 3096 3024 (a) Find the average rate of change in the amount spent on tobacco products between 1987 and 1992. Give units, Answer: The average rate of change = I and its units = ? (b) During this six-year period, select the one-year intervals during which the average rate of change was negative. There may be more than one correct answer. A. Between 1987 and 1988 B. Between 1988 and 1989 C. Between 1989 and 1990 )D. Between 1990 and 1991 DE. Between 1991 and 1992 F. Between 1992 and 1993 ()G. None of the aboveEvaluate the limit 3(1 + h)2 - 3 lim h-0 h Hint: Simplify the expression first, then take the limit
Step by Step Solution
There are 3 Steps involved in it

Get step-by-step solutions from verified subject matter experts