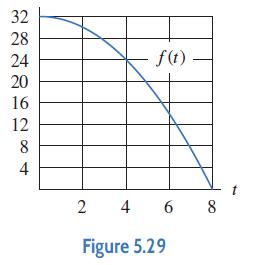
Question: Using Figure 5.29, draw rectangles representing each of the following Riemann sums for the function f on the interval 0 t 8. Calculate
Using Figure 5.29, draw rectangles representing each of the following Riemann sums for the function f on the interval 0 ≤ t ≤ 8. Calculate the value of each sum.
(a) Left-hand sum with Δt = 4
(b) Right-hand sum with Δt = 4
(c) Left-hand sum with Δt = 2
(d) Right-hand sum with Δt = 2

32 28 24 20 16 12 8 4 2 f(t) 4 6 Figure 5.29 8 t
Step by Step Solution
3.40 Rating (159 Votes )
There are 3 Steps involved in it
a Lefthand sum 32 4 24 4 224 b Righthand sum 24 4 0 ... View full answer

Get step-by-step solutions from verified subject matter experts


