

Question: Develop a single script to (a) generate contour and mesh subplots of the following temperature field in a similar fashion to Example 7.4: T (x,
Develop a single script to (a) generate contour and mesh subplots of the following temperature field in a similar fashion to Example 7.4: T (x, y) = 2x2 + 3y2 − 4xy − y − 3x and (b) determine the minimum with f min search.
Example 7.4
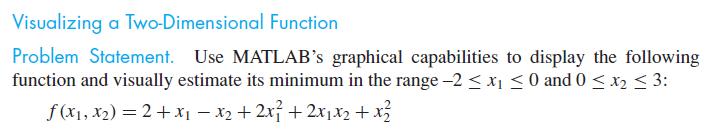
Visualizing a Two-Dimensional Function Problem Statement. Use MATLAB's graphical capabilities to display the following function and visually estimate its minimum in the range -2 x 0 and 0 x 3: f(x, x) = 2 + x - x + 2x + 2xx + x
Step by Step Solution
3.42 Rating (165 Votes )
There are 3 Steps involved in it
ANSWER To visualize the function we can use MATLABs surf function to create a 3D surface plot and co... View full answer

Get step-by-step solutions from verified subject matter experts