

Question: Develop an M-file function to compute descriptive statistics for a vector of values. Have the function determine and display number of values, mean, median, mode,
Develop an M-file function to compute descriptive statistics for a vector of values. Have the function determine and display number of values, mean, median, mode, range, standard deviation, variance, and coefficient of variation. In addition, have it generate a histogram. Test it with the data from Prob. 14.3.
Data From Problem 14.3
Given the data
Determine (a) the mean, (b) median, (c) mode, (d) range, (e) standard deviation, (f) variance, and (g) coefficient of variation.
(h) Construct a histogram. Use a range from 28 to 34 with increments of 0.4.
(i) Assuming that the distribution is normal, and that your estimate of the standard deviation is valid, compute the range (i.e., the lower and the upper values) that encompasses 68% of the readings. Determine whether this is a valid estimate for the data in this problem.
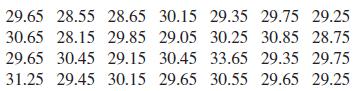
29.65 28.55 28.65 30.15 29.35 29.75 29.25 30.65 28.15 29.85 29.05 30.25 30.85 28.75 29.65 30.45 29.15 30.45 33.65 29.35 29.75 31.25 29.45 30.15 29.65 30.55 29.65 29.25
Step by Step Solution
3.48 Rating (155 Votes )
There are 3 Steps involved in it
ANSWER the Mfile function that computes the descriptive statistics and generates the histogram funct... View full answer

Get step-by-step solutions from verified subject matter experts