

Question: Fit an exponential model to Plot the data and the equation on both standard and semilogarithmic graphs with the MATLAB subplot function. x 0.4 y
Fit an exponential model to
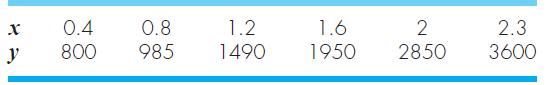
Plot the data and the equation on both standard and semilogarithmic graphs with the MATLAB subplot function.
x 0.4 y 800 0.8 985 1.2 1490 1.6 1950 2 2850 2.3 3600
Step by Step Solution
★★★★★
3.37 Rating (166 Votes )
There are 3 Steps involved in it
1 Expert Approved Answer
Step: 1 Unlock

Question Has Been Solved by an Expert!
Get step-by-step solutions from verified subject matter experts
Step: 2 Unlock
Step: 3 Unlock