

Question: The loglog function operates in an identical fashion to the plot function except that logarithmic scales are used for both the x and y axes.
The loglog function operates in an identical fashion to the plot function except that logarithmic scales are used for both the x and y axes. Use this function to plot the data and function as described in Prob. 2.13. Explain the results.
Data From Problem 2.13
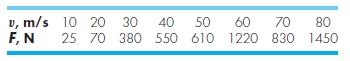
Here are some wind tunnel data for force (F) versus velocity (ν):
These data can be described by the following function:
F = 0.2741ν1.9842
Use MATLAB to create a plot displaying both the data (using circular magenta symbols) and the function (using a black dash-dotted line). Plot the function for v = 0 to 100 m/s and label the plot’s axes.
v, m/s 10 20 30 40 50 60 70 F, N 25 70 380 550 610 1220 830 80 1450
Step by Step Solution
3.33 Rating (168 Votes )
There are 3 Steps involved in it
Define the velocity range from 0 to 100 ms with a step size of 01 ms Define the function F as F 0274... View full answer

Get step-by-step solutions from verified subject matter experts