

Question: Use MATLAB to generate 32 points for the sinusoid depicted in Fig. 16.2 from t = 0 to 6 s. Compute the DFT and create
Use MATLAB to generate 32 points for the sinusoid depicted in Fig. 16.2 from t = 0 to 6 s. Compute the DFT and create subplots of
(a) The original signal,
(b) The real part, and
(c) The imaginary part of the DFT versus frequency.
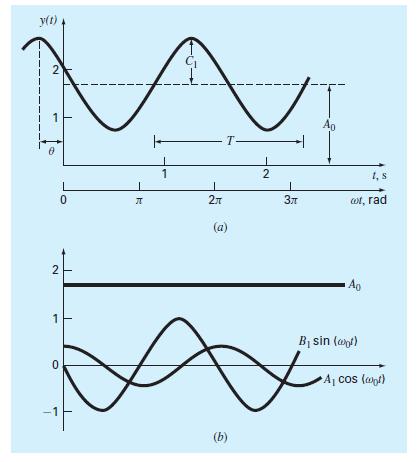
y(t) I 1 2 2 1 0 0 E 1 I 2 (a) (b) 2 I 3 Ao cot, rad Ao 1, s B sin (at) A cos (pt)
Step by Step Solution
★★★★★
3.32 Rating (158 Votes )
There are 3 Steps involved in it
1 Expert Approved Answer
Step: 1 Unlock

Sure heres the MATLAB code to generate 32 points for the sinusoid depicted in Fig 162 from t 0 to 6 s compute the DFT and create subplots of the origi... View full answer
Question Has Been Solved by an Expert!
Get step-by-step solutions from verified subject matter experts
Step: 2 Unlock
Step: 3 Unlock