

Question: Please I need help to code this assignemt in code by code in MATLAB. I need all of them this is my first time coding
Please I need help to code this assignemt in code by code in MATLAB. I need all of them this is my first time coding MATLAB and I'm facing defeculties. Thank you.
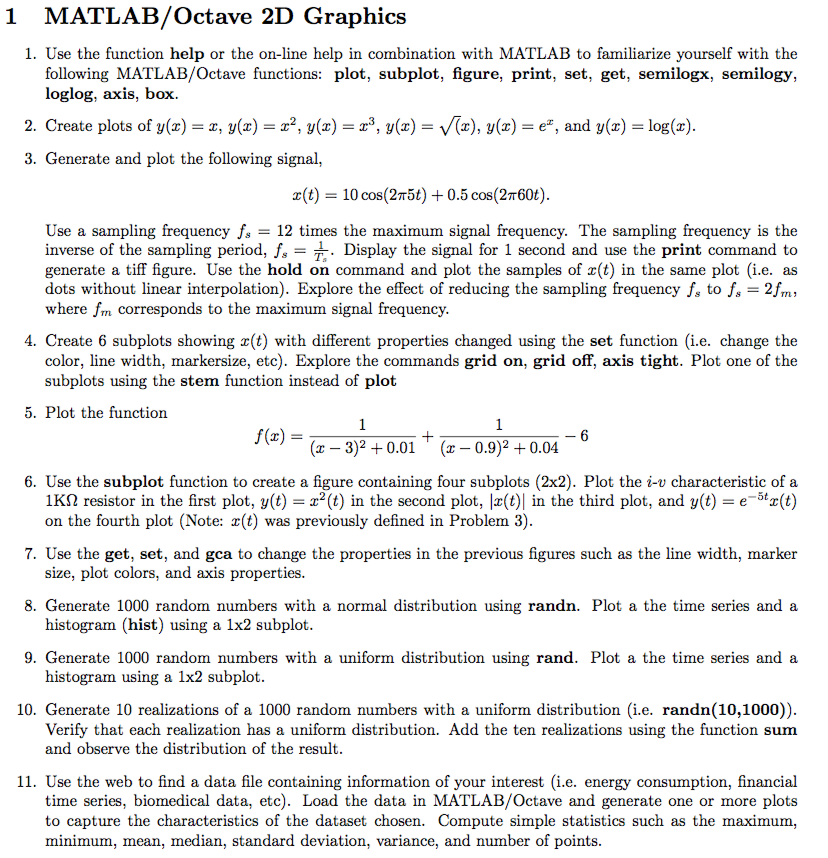
1 MATLAB/Octave 2D Graphics 1. Use the function help or the on-line help in combination with MATLAB to familiarize yourself with the following MATLAB/Octave functions: plot, subplot, figure, print, set, get, semilogx, semilogy, oglog, axis, box 2. Create plots of y() z, y)2, y 3. Generate and plot the following signal, 2(t) (x)), y(x)e and y(x) log(x) 10 cos(2m5t) 0.5 cos(2m60t) Use a sampling frequency fs 12 times the maximum signal frequency. The sampling frequency is the inverse of the sampling period, Display the signal for 1 second and use the print command to generate a tiff figure. Use the hold on command and plot the samples of x(t) in the same plot (i.e. as dots without linear interpolation). Explore the effect of reducing the sampling frequency fs to fs 2fm, where fm corresponds to the maximum signal frequency. 4. Create 6 subplots showing x(t) with different properties changed using the set function (i.e. change the color, line width, markersize, etc). Explore the commands grid on, grid off, axis tight. Plot one of the subplots using the stem function instead of plot 5. Plot the function (x - 3)2 +0.01 (x 0.9)2+0.04 6. Use the subplot function to create a figure containing four subplots (2x2). Plot the i-v characteristic of a e 5t2(t) 7. Use the get, set, and gca to change the properties in the previous figures such as the line width, marker 8. Generate 1000 random numbers with a normal distribution using randn. Plot a the time series and a 9. Generate 1000 random numbers with a uniform distribution using rand. Plot a the time series and a 10. Generate 10 realizations of a 1000 random numbers with a uniform distribution (i.e. randn(10,1000)) 1 resistor in the first plot, y(t) z?(t) in the second plot, r(t) in the third plot, and y(t) on the fourth plot (Note: x(t) was previously defined in Problem 3) size, plot colors, and axis properties histogram (hist) using a 1x2 subplot histogram using a 1x2 subplot Verify that each realization has a uniform distribution. Add the ten realizations using the function sum and observe the distribution of the result. 11. Use the web to find a data file containing information of your interest (i.e. energy consumption, financial time series, biomedical data, etc). Load the data in MATLAB/Octave and generate one or more plots to capture the characteristics of the dataset chosen. Compute simple statistics such as the maximum, minimum, mean, median, standard deviation, variance, and number of points
Step by Step Solution
There are 3 Steps involved in it

Get step-by-step solutions from verified subject matter experts