

Question: You contact the jumpers used to generate the data in Table 2.1 and measure their frontal areas. The resulting values, which are ordered in the
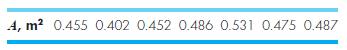
You contact the jumpers used to generate the data in Table 2.1 and measure their frontal areas. The resulting values, which are ordered in the same sequence as the corresponding values in Table 2.1, are
(a) If the air density is ρ = 1.223 kg/m3, use MATLAB to compute values of the dimensionless drag coefficient CD.
(b) Determine the average, minimum and maximum of the resulting values.
(c) Develop a stacked plot of A versus m (upper) and CD versus m (lower). Include descriptive axis labels and titles on the plots.
4, m 0.455 0.402 0.452 0.486 0.531 0.475 0.487
Step by Step Solution
3.36 Rating (162 Votes )
There are 3 Steps involved in it
ANSWER a This is the MATLAB code for computing the ... View full answer

Get step-by-step solutions from verified subject matter experts