

Question: Use Stata, SPSS, or Excel for the questionnaire in Fig. 2.1, and enter the data from Fig. 3.1. Allow for missing values in the dataset.
Use Stata, SPSS, or Excel for the questionnaire in Fig. 2.1, and enter the data from Fig. 3.1. Allow for missing values in the dataset.
Figure 2.1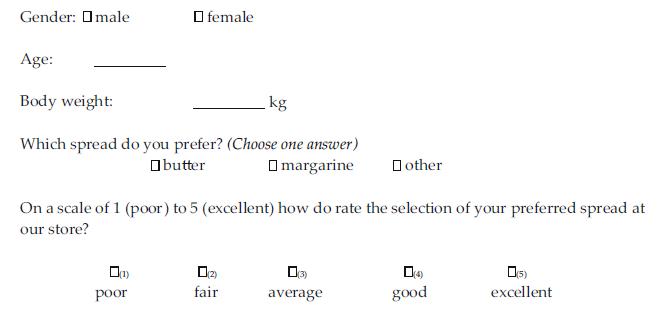
Figure 3.1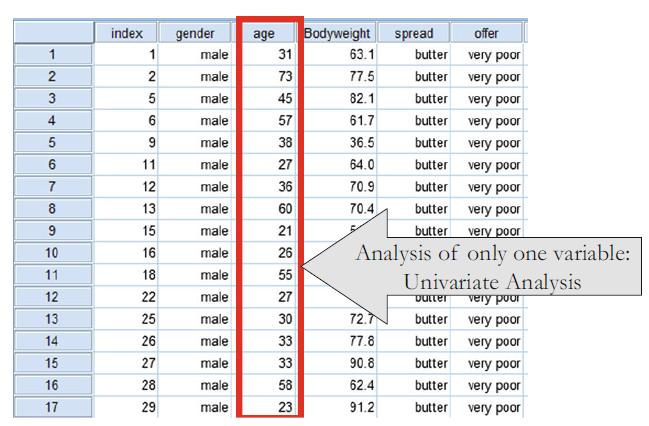
Gender: male female Age: Body weight: Which spread do you prefer? (Choose one answer) butter margarine 001) poor kg On a scale of 1 (poor) to 5 (excellent) how do rate the selection of your preferred spread at our store? 0(2) fair other average (4) good 0(5) excellent
Step by Step Solution
★★★★★
3.35 Rating (161 Votes )
There are 3 Steps involved in it
1 Expert Approved Answer
Step: 1 Unlock

Question Has Been Solved by an Expert!
Get step-by-step solutions from verified subject matter experts
Step: 2 Unlock
Step: 3 Unlock