

Vegas Villas is a time-share resort located several blocks off the strip in Las Vegas. There are
Question:
Vegas Villas is a time-share resort located several blocks off the strip in Las Vegas. There are a variety of types of units in the Vegas Villas, including single-room studios, one-, two-, and three-bedroom suites, and a few presidential suites. All include full kitchens, a barbeque grill on the patio, washer and dryer in suite, large flat screen TVs, a fireplace, and more. The resort grounds include amenities such as a pool, waterslides, several hot tubs, a lazy river, two tennis courts, a putting green, a gourmet restaurant, and a bar.
Owners buy in to the Vegas Villas by purchasing a number of vacation credits that then renew annually. These credits can then be used to book stays throughout each year. The minimum purchase is 3,000 vacation credits, which would allow for a two-night weekend stay in a studio each year. Larger units and longer stays are available with additional vacation credits. While you incur a large up-front cost to buy in by purchasing vacation credits, this purchase also makes you a partial owner of the property. Since your vacation credits renew each year, you can then visit the property every year at no cost. The only ongoing expenses are maintenance fees due annually.
Silver State Development (SSD) is the developer of the Vegas Villas. To entice new buyers, SSD offers bargain vacations in Las Vegas. For $69, you can spend three nights in the Vegas Villas, have a free meal at the gourmet restaurant, and see your choice of one of several Las Vegas shows. The only catch is that you are required to attend a 90-minute presentation where sales representatives go through the benefits of ownership in the Vegas Villas with you, one-on-one, with the hope you will buy in with a purchase of vacation credits.
The bargain vacations allow the potential buyers an opportunity to experience the resort and see first-hand the benefits of ownership. SSD has been moderately successful at turning these bargain vacations into sales of vacation credits with a 25 percent success rate. However, offering these bargain vacations is a costly endeavor. Therefore, SSD would only like to offer them to those who would be likely to buy vacation credits.
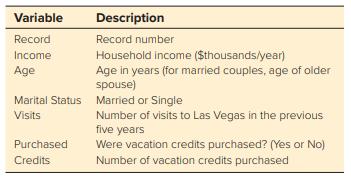
SSD requires a completed survey to claim a bargain vacation. The collected data includes household income, age, marital status, and the number of times visiting Las Vegas in the previous five years. Furthermore, SSD tracks which vacationers have gone on to purchase credits at Vegas Villas and how many credits were purchased. They would like to use the data to help predict likely buyers and therefore determine who should be offered a bargain vacation.
The dataset includes 842 historical records and is provided in the spreadsheet file titled Vegas Villas Data available at www.mhhe.com/Hillier7e. A data dictionary for the dataset is shown below.
Use these data to perform each of the following steps of a descriptive and predictive analytics study. For parts a, b, and c, use the dataset on the Original Data tab of the spreadsheet. Clean the data:
a. Search for missing data. Identify the records that have missing data by specifying the record number and the data that are missing.
b. Search for mis-entered data by sorting each column to look for outliers. List any suspicious data, indicating the record number, what is suspicious, and if possible, conjecture on the likely true value.
c. Some analysis requires numerical rather than text data. Add two columns to the dataset labeled “Married 0/1” and “Purchased 0/1.” Transform the data in the “Marital Status” column to 0’s and 1’s in the new “Married 0/1” column with a 1 representing Married and a 0 representing Single. Transform the Yes and No data in the “Purchased” column to 0’s and 1’s in the new “Purchased 0/1” column with a 1 representing Yes and a 0 representing No.
Assume now that missing and suspicious data have been investigated and that all of the data have been cleaned as needed. The cleaned data are available on the Clean Data tab of the spreadsheet file. For the remaining parts, use the dataset on the Clean Data tab to perform the analysis.
Explore the data quantitatively:
d. For each column of numerical data (Income, Age, Visits, Married 0/1, Purchased 0/1, Credits Purchased) in the dataset, calculate the mean, median, standard deviation, minimum, and maximum.
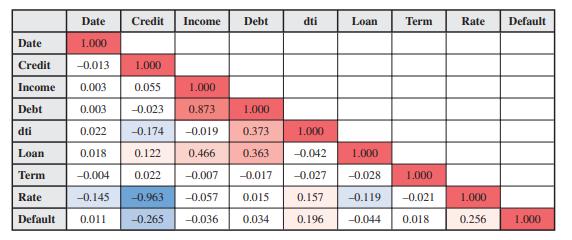
e. Create a correlation table showing the correlation coefficient between each pair of the following five variables: Income, Age, Married 0/1, Visits, Purchased 0/1. The table should be a 5-by-5 table with the lower diagonal filled in similar to Figure 2.10.
f. Sort the data by Income. Comment on observed results regarding the purchase of vacation credits for those with the highest and lowest income. Repeat, but now sorting by Age and then Visits. Explore the data visually:
g. Generate a scatter plot with Credits on the vertical axis and Income on the horizontal axis. Comment on any observations.
h. Generate a bar chart showing the probability of purchase by Marital Status. Comment on any observations. Develop a model:
i. Predictor variables that have a large impact on whether or not a purchase of vacation credits is made are good candidates to include in a classification model such as KNN. Based on the exploration of the data, which predictor variables are good candidates? Partition the dataset to refine the model:
j. Using the predictor variables determined in part i, apply the KNN algorithm. Rescale the data using standardization. Partition the historical records into a training partition (60 percent of the records) and a validation partition (the remaining 40 percent of the records). Searching over values of k from 1 to 10, find the value for k in the KNN algorithm that maximizes the accuracy (or equivalently, minimizes misclassification) when it is used to classify potential buyers from the validation partition as likely to purchase (at least a 25 percent chance) or not (less than a 25 percent chance).
k. Using the best value for k determined in part j, determine the accuracy, sensitivity, and specificity for the KNN algorithm.
Make predictions:
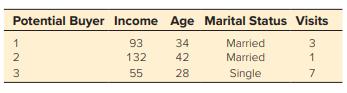
l. Apply the KNN algorithm using the entire (unpartitioned) data set, with the predictor variables determined in part i and the best value for k determined in part j. Classify each of the following potential buyers as either likely to purchase (at least a 25 percent chance) or not (less than a 25 percent chance). Also indicate the estimated probability of purchase for each.
Data from Figure 2.10
A correlation table showing the correlation between each pair of numerical variables in the First Bank dataset. This table is visualized as a heat map, with positive correlations shown in red (darker shades for stronger correlation) and negative correlations shown in blue (darker shades for stronger negative correlation).
Step by Step Answer:
a Record 102 is missing Purchase and Credits data Record 287 is missing Income data b Record 107 Income is 58234 58234000 Perhaps entered as instead o...View the full answer


Introduction To Management Science and Business Analytics A Modeling And Case Studies Approach With Spreadsheets
ISBN: 9781260716290
7th Edition
Authors: Frederick S. Hillier, Mark S. Hillier
