

Question: Use the profile log likelihood plot in the previous exercise to obtain a nominal 95% confidence interval for (tau). Data From previous exercise Section 5.4.2
Use the profile log likelihood plot in the previous exercise to obtain a nominal 95\% confidence interval for \(\tau\).
Data From previous exercise
Section 5.4.2
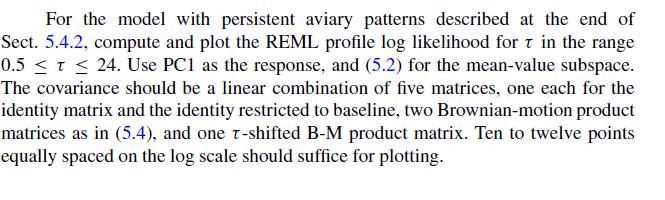
For the model with persistent aviary patterns described at the end of Sect. 5.4.2, compute and plot the REML profile log likelihood for in the range 0.5 T 24. Use PC1 as the response, and (5.2) for the mean-value subspace. The covariance should be a linear combination of five matrices, one each for the identity matrix and the identity restricted to baseline, two Brownian-motion product matrices as in (5.4), and one T-shifted B-M product matrix. Ten to twelve points equally spaced on the log scale should suffice for plotting.
Step by Step Solution
3.44 Rating (154 Votes )
There are 3 Steps involved in it
python import numpy as np import matplotlibpyplot as plt from scipystats import chi... View full answer

Get step-by-step solutions from verified subject matter experts