

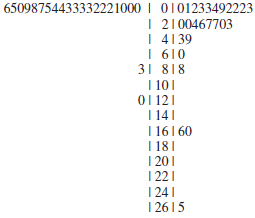
Question: A back-to-back stem-and-leaf display on two data sets is conducted by hanging the data on both sides of the same stems. Here is a back-to-back
How does the back-to-back stem-and-leaf display show the differences in the data set in a way that the dotplot cannot?
65098754433332221000 I 0101233492223 | 2100467703 I 4139 I 610 31 818 I 101 01 121 1 141 1 161 60 1 181 I 201 | 221 1 241 1 2615
Step by Step Solution
★★★★★
3.45 Rating (161 Votes )
There are 3 Steps involved in it
1 Expert Approved Answer
Step: 1 Unlock

A backtoback steamandleaf display is useful when t... View full answer
Question Has Been Solved by an Expert!
Get step-by-step solutions from verified subject matter experts
Step: 2 Unlock
Step: 3 Unlock