

An article in Bioresource Technology [Preliminary Tests on Nisin and Pediocin Production Using Waste Protein Sources: Factorial
Question:
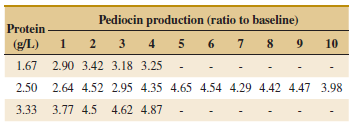
(a) Construct box plots of the data. What visual impression do you have from these plots?
(b) Does the level of protein have an effect on mean pediocin production? Use α = 0.05.
(c) Would you draw a different conclusion if α = 0.01 had been used?
(d) Plot the residuals from the experiment and comment. In particular, comment on the normality of the residuals.
(e) Find a 95% confidence interval on mean pediocin production when the level of protein is 2.50 g/L.
Fantastic news! We've Found the answer you've been seeking!
Step by Step Answer:
a The following box plot suggests that the protein at level 167 prod...View the full answer

Answered By
John Aketch
I am a dedicated person with high degree of professionalism, particularly in academic writing. My desire is to is to make students excel in their academic endeavor.
3+ Reviews
10+ Question Solved
Related Book For 

Applied Statistics And Probability For Engineers
ISBN: 9781118539712
6th Edition
Authors: Douglas C. Montgomery, George C. Runger
Question Posted:
