

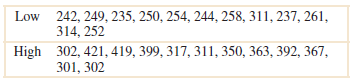
Question: An article in Quality Engineering [2012, Vol. 24(1)] described an experiment on a grinding wheel. The following are some of the grinding force data (in
(a) Is there evidence to support the claim that the mean grinding force increases with the vibration level?
(b) Find a 95% confidence interval for the difference in the mean grinding force for the two vibration levels.
(c) Is the value zero contained in the 95% confidence interval? Explain the connection with the conclusion you reached in part (a).
(d) Do normal probability plots of grinding force indicate any violations of the assumptions for the tests and confidence interval that you performed?
242, 249, 235, 250, 254, 244, 258, 311, 237, 261, 314, 252 High 302, 421, 419, 399, 317, 311, 350, 363, 392, 367, 301, 302 Low
Step by Step Solution
3.40 Rating (169 Votes )
There are 3 Steps involved in it
a 1 The parameter of interest is the difference in mean grinding force between vibration l... View full answer

Get step-by-step solutions from verified subject matter experts