

Question: An article in Quality Engineering [Mean and Variance Modeling with Qualitative Responses: A Case Study (19981999, Vol. 11, pp. 141148)] studied how three active ingredients
(a) Fit a second-order response surface model to the data.
(b) Construct contour plots and response surface plots for MLS. What are your conclusions?
(c) Analyze the residuals from this experiment. Does your analysis indicate any potential problems?
(d) This design has only a single center point. Is this a good design in your opinion?
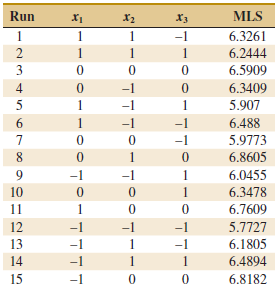
Run MLS X3 1 1 -1 6.3261 1 1 6.2444 3 6.5909 6.3409 -1 5.907 1 1 1 -1 -1 6.488 -1 5.9773 6.8605 6.0455 -1 -1 1 10 1 6.3478 6.7609 11 1 12 -1 -1 -1 5.7727 13 6.1805 14 1 1 6.4894 15 -1 6.8182 45 6789=p:
Step by Step Solution
3.51 Rating (158 Votes )
There are 3 Steps involved in it
a b Contour Plots Response surface plots There is curvature from the secondo... View full answer

Get step-by-step solutions from verified subject matter experts