

Question: An article in Quality Engineering [Is the Process Capable? Tables and Graphs in Assessing C pm (1992, Vol. 4(4)]. Considered manufacturing data. Specifications for the
(a) Construct a control chart for individual measurements. Revise the control limits if necessary.
(b) Compare your chart in part (a) to one that uses only the last (least significant) digit of each diameter as the measurement. Explain your conclusion.
(c) Estimate μ and σ from the moving range of the revised chart and use this value to estimate PCR and PCRk and interpret these ratios.
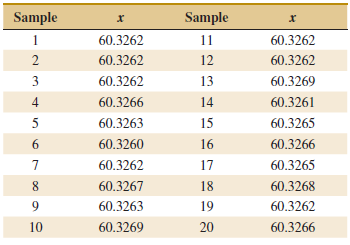
Sample Sample 60.3262 11 60.3262 60.3262 12 60.3262 60.3269 3 60.3262 13 4 60.3266 14 60.3261 5 60.3263 15 60.3265 60.3260 16 60.3266 60.3262 17 60.3265 60.3267 18 60.3268 60.3263 19 60.3262 60.3266 10 60.3269 20
Step by Step Solution
3.31 Rating (172 Votes )
There are 3 Steps involved in it
a Using IMR chart b The chart is identical to the chart in part a except for the s... View full answer

Get step-by-step solutions from verified subject matter experts